The note entitled "The Function of the Central Bank" which is present on this website, concluded that "it is impossible to sustain the notion of skilful time-critical steering of the economy by the central bank, or even that the central bank does in fact determine short term interest rates. On the contrary, the proposition, that commercial short-term interest rates are in fact followed by the central bank, seems generally to be in accordance with the observed facts." The voluminous journalistic and political commentary on interest rate changes, not noticeably contradicted by academic voices, was characterised as "not scientific or objective description, but a practised rhetoric which is tailored to suit what is known to be an uncritical audience".
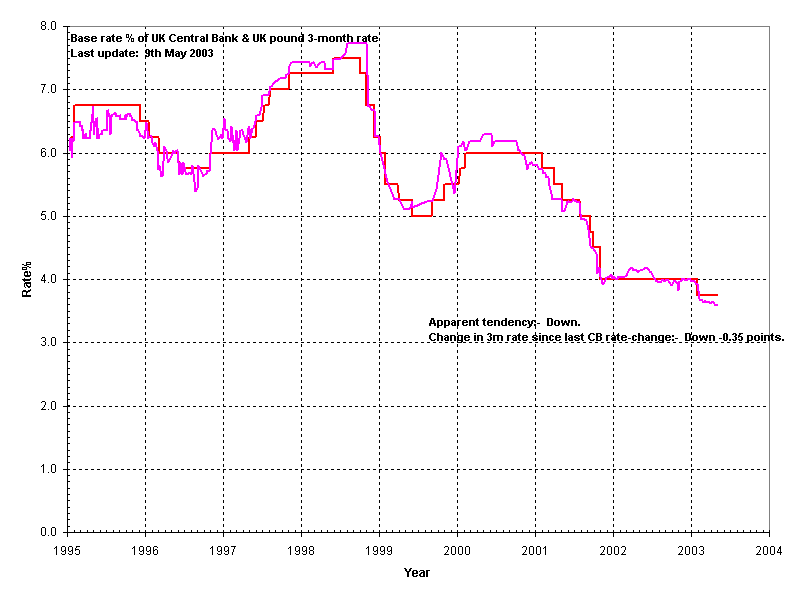
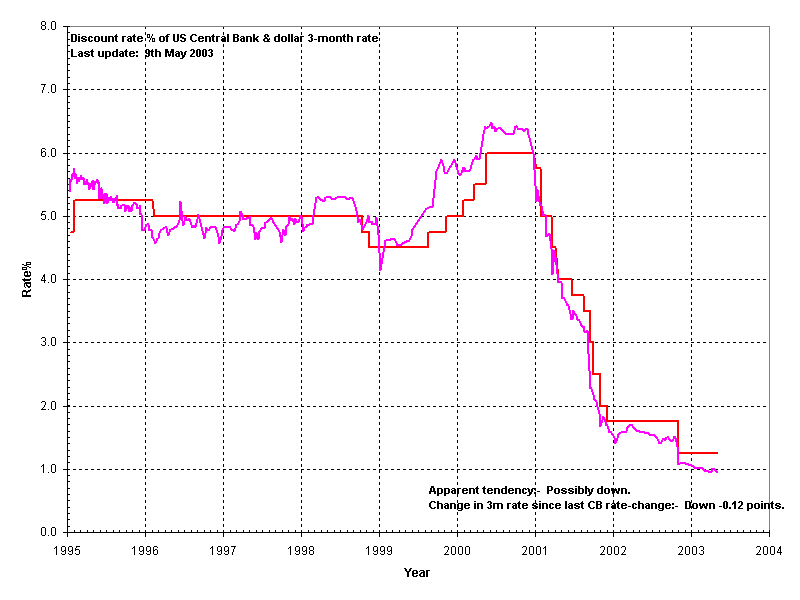
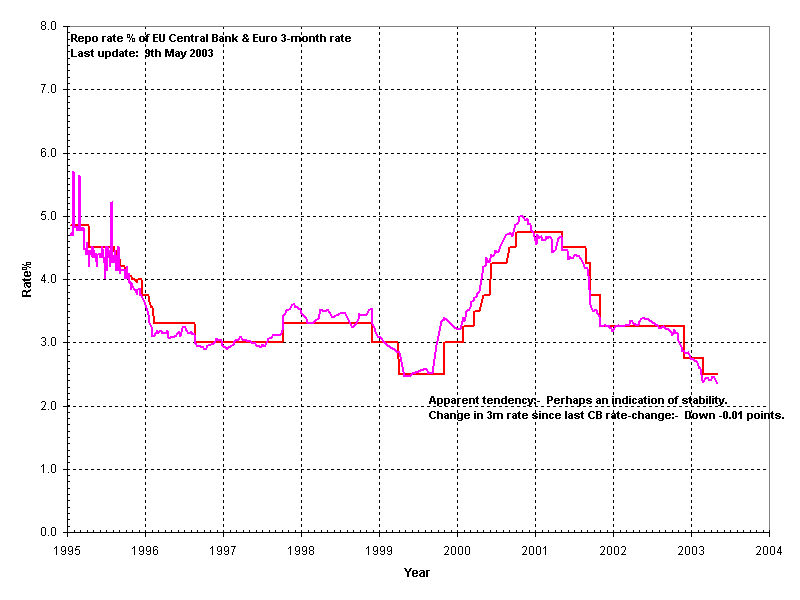
The evidence presented was a comparison of time-series for central bank rate, and the 3-month commercial rate, for the period from January 1995 to the time of drafting of the note, January 2002. The three currency zones treated were the UK, the US, and the EU Eurozone.
This note brings the data up to date, and the intention is to re-issue this note, nominally at weekly intervals. It recalls the remark in the previous note: "At the risk of appearing flippant, it might be said to be that, far from needing immense skill, any reasonably able child could look at the trend of US 3-month market rates, and issue his or her decision at intervals, as and when a quarter point or a half point adjustment to the base rate was necessary to keep up".
An addendum is added, which gives the results of some statistical work which arose in its preparation. Apart from the confirmatory nature of these results, they give rise to a datum or parameter which may aid the eye in judging the recent trends in short-term interest rates. This parameter is given in figures 1 to 3, the figures which will be updated at intervals.
In order to interpret these three figures, it is probably helpful, perhaps essential, to be familiar with the previous paper.
Reference should be made to the previous note for more information on the provenance of the data. Briefly, it is taken from tables published daily by the Financial Times. Currently, these are Libor 3-month market rates. A table of official rates is also given daily, although these change only infrequently.
There is no reason to imagine that the central bank rate and the 3-month rate must run at the same absolute level - we are concerned only with the signal given by changes in the 3-month rate. Thus, in the previous paper, it was found helpful to lower the absolute level of the 3-month rate, for comparison with the bank rate level, by 0.325 percentage point for the US, 0.1 for the Euro, and 0.015 (effectively zero) for the pound. This is done in the graphs below.
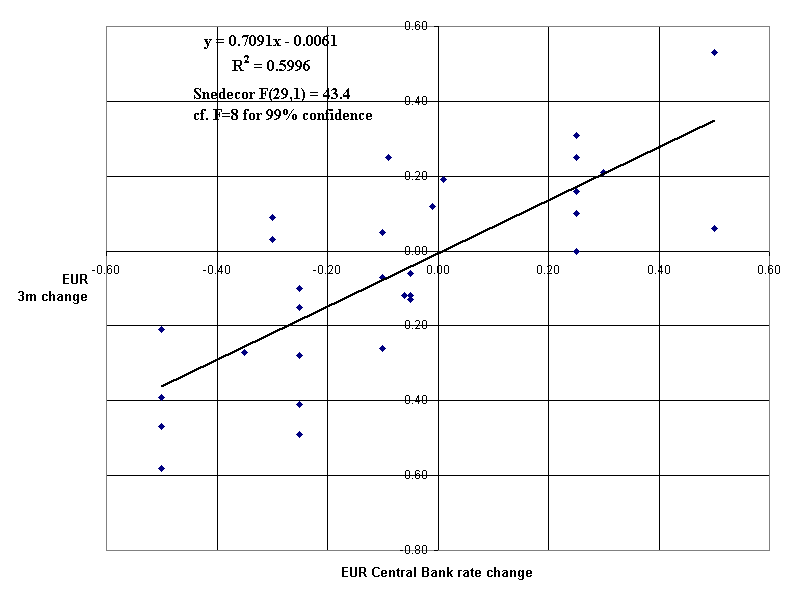
Each graph, one for each of the three zones, carries the author's impression of the current signal delivered by recent trends in the 3-month rate, as seen by eye. Also given is the change in the 3-month rate since the day on which the lst bank rate step was published. The relevance of this parameter is the subject of the addendum. Since central banks have in the past few years tended to change the rate by a quarter or half of a percentage point, any absolute value of this parameter around or above this level might be regarded as significant, if appreciated in the statistical context discussed in the addendum.
In the previous paper, it was stressed that the method used relied essentially on judgment by eye – as follows:-
"It was hoped to apply some mathematical procedure to the time-series data for the base rate and for the 3-month rate, to produce numerical 'confidence limits' for the truth of a 'hypothesis' that set A leads set B by so many weeks or days, or for a 'null hypothesis' that neither leads the other. However, it became clear on examination that even this simple relationship of two parameters is too quirky to be captured by simple algebra. There is nothing for it but to look and see."
Later, it was noted that this was "not because academic treatments are in this case over-powerful, but because they are hopelessly simplistic and inadequate".
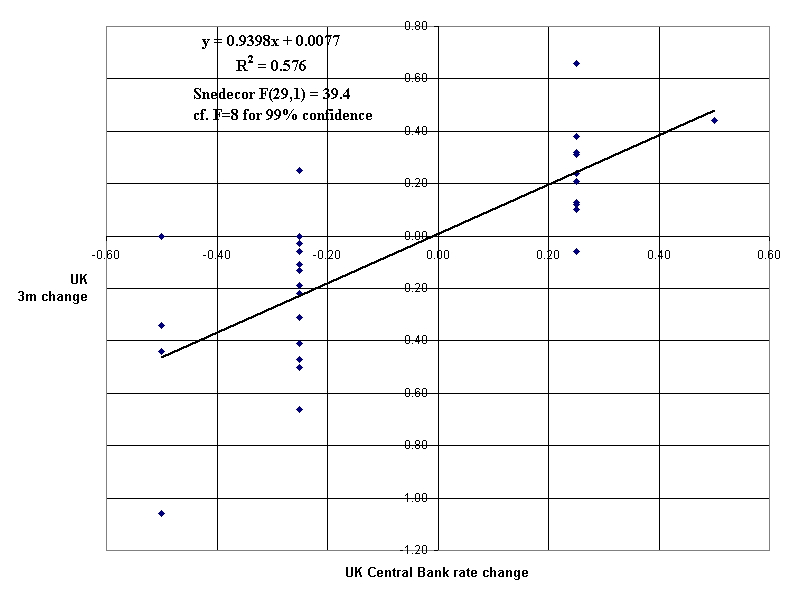
In the course of this update, a possible numerical method was explored further. The method tested was to compare:
(a) the change in the 3-month rate observed at the time of the bank rate change, measured from the time of the previous change, with
(b) the size and sign of the "current" bank rate change.
The probability of this yielding a method better than judgment by eye is small, since it effectively replaces the detailed path of the 3-month rate, which can be assessed by eye fairly easily, with a path which has two or three points for each period between bank rate changes, i.e., a path of straight-line segments which is indifferent to what small or wild changes may in reality be followed within the period of each segment. The idea was, however, that if there was a very high correlation of today’s bank rate change with one definable and observable previous commercial money-market change, this would be close to a numerical proof that the central bank interest rates are led by the market. Such a proof may be more convincing than one which appeals, however plausibly, to visual judgments.
The results are shown in the figures below. All figures show the changes (a) and (b) on the y and x-axes respectively.
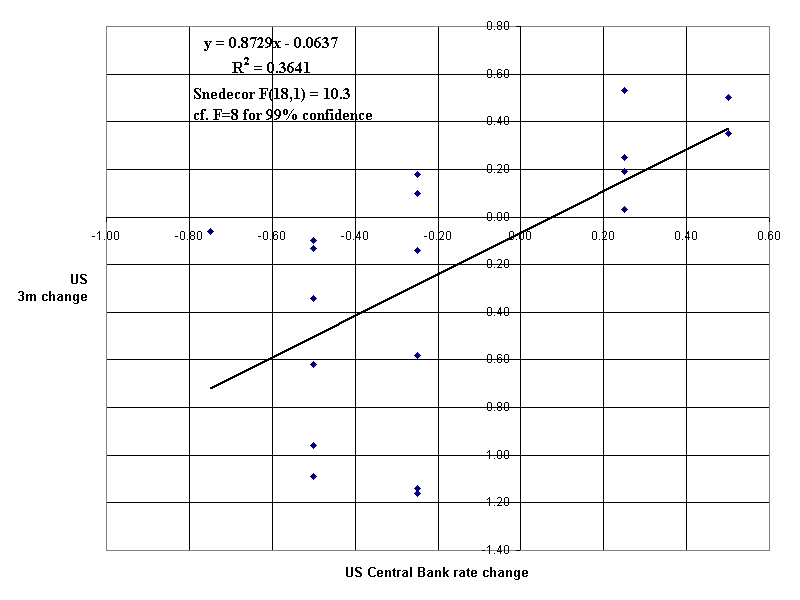
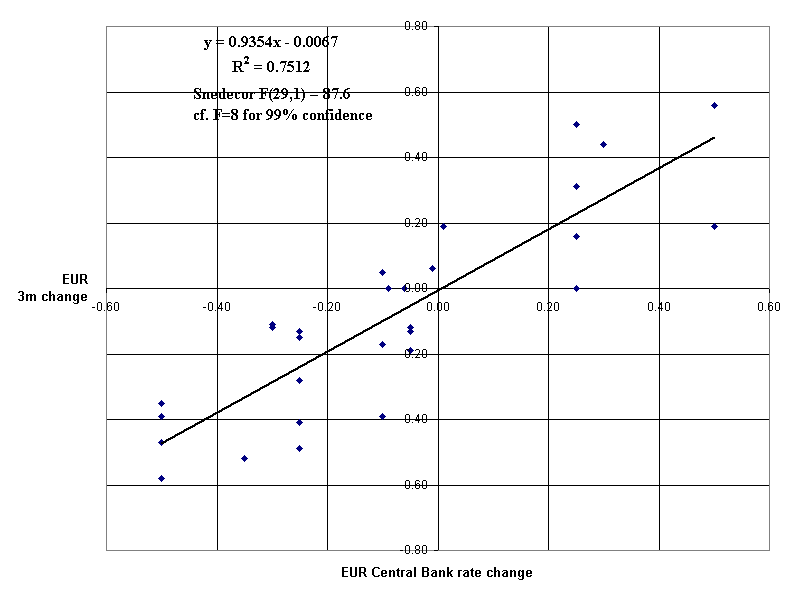
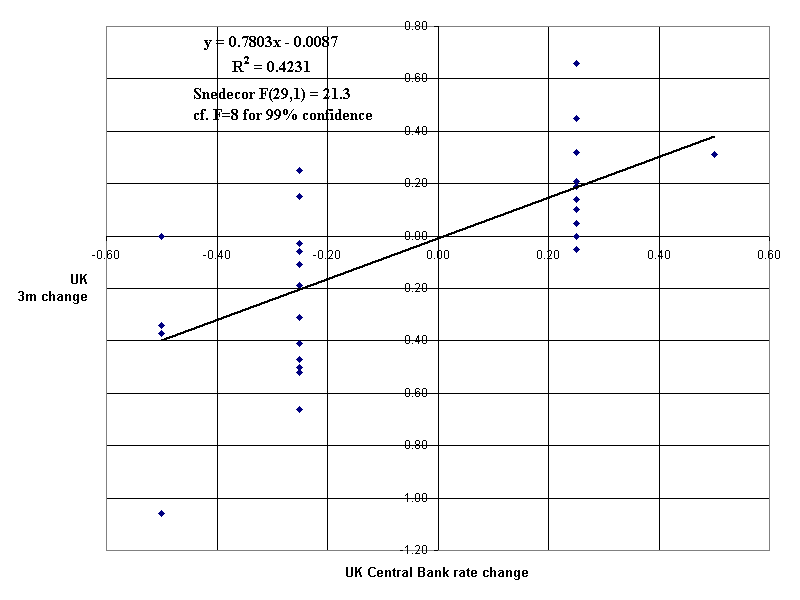
The first three figures, A1 to A3, one for each zone, take (a) to refer to the entire period from the “present” central bank rate change, back to the previous bank rate change.
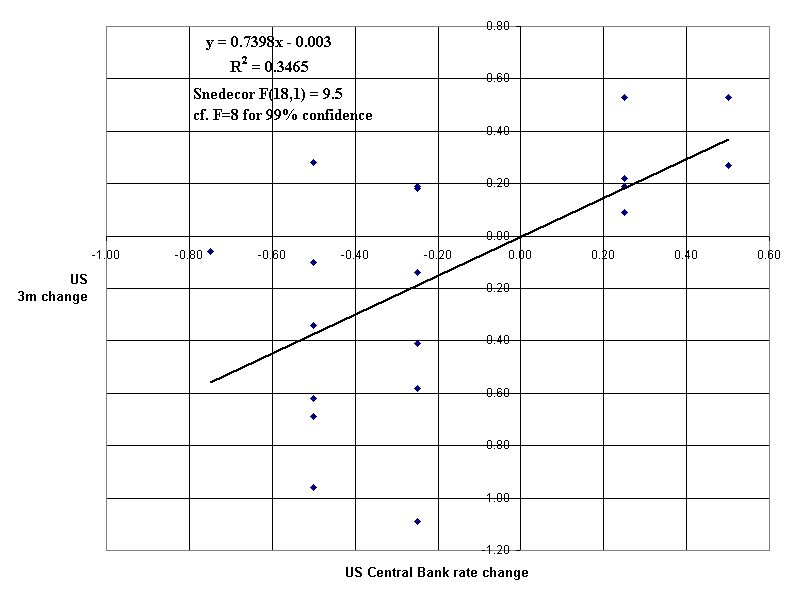
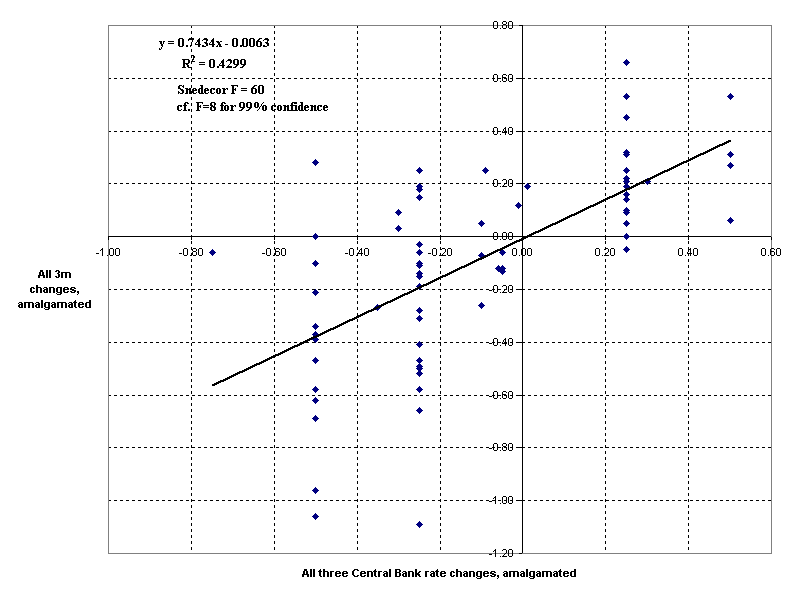
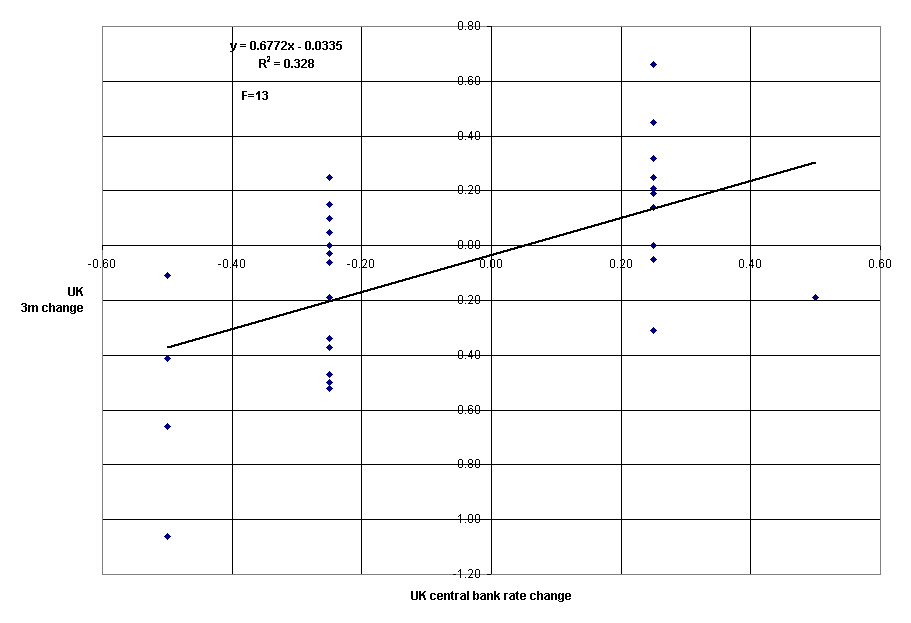
The second set of three figures, A4 to A6, takes (a) to refer to the period from the last observation of the 3-month rate before the bank rate change, back to the previous bank rate change. The rational for this is that that my "schoolboy" central bank manager would see the historical series only up to that last observation point.
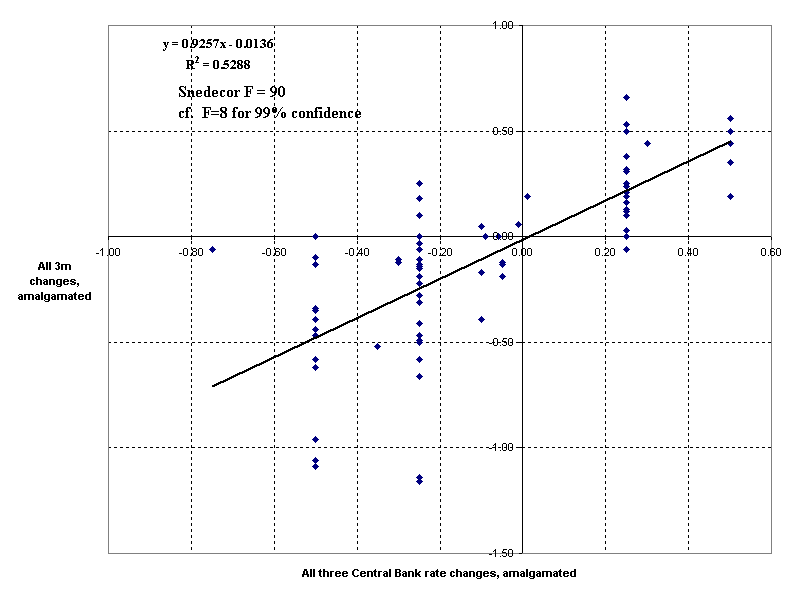
Figure A7 amalgamates the data of figures A1 to A3. Figure A8 does the same for figures A4 to A6.
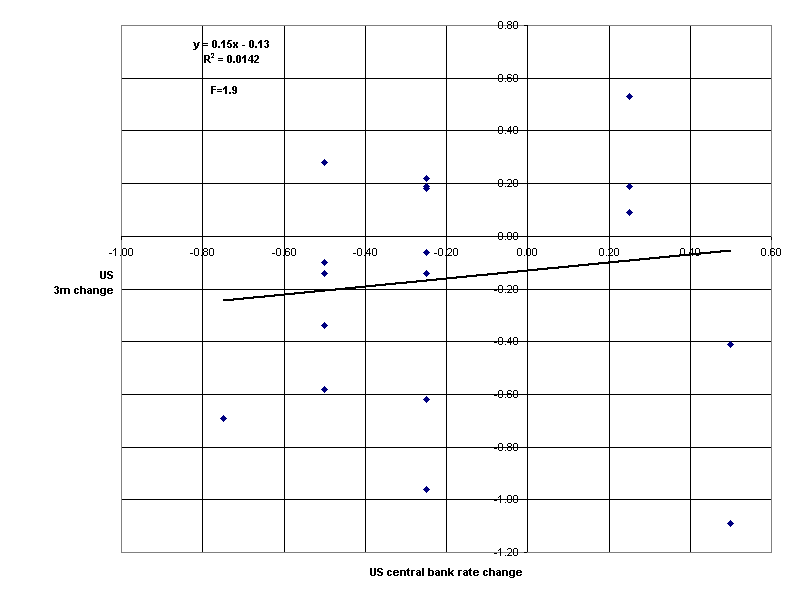
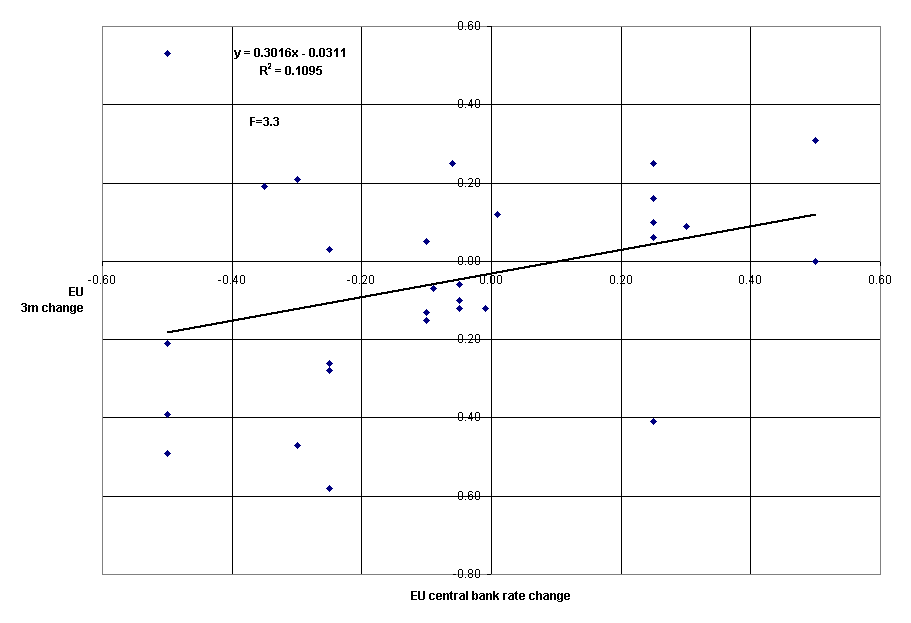
Figures A9 to A11 reverse the implied direction of cause and effect of figures A4 to A6. The current bank rate change is correlated with the change in the 3-month rate in the period after that change, up to the last observation point before the next bank rate change. The normal story is that bank rate change determines this future.
In all figures, the equation of a straight-line least-squares fit and the value of R-squared, the correlation coefficient, are given. These data are calculated automatically by the Excel program, to the (probably unjustified) number of significant figures shown. Since R-squared takes no account of the number of points and degrees of freedom, the derived value of the Snedecor F has been inserted. For the sorts of numbers involved in these graphs, if F exceeds 8, the probability of the apparent correlation being produced by chance is less than 1%. This is the more rigorous of the two levels of confidence (5% and 1%) generally employed. All graphs show correlations exceeding this level of acceptability, mostly by a wide margin. That is, the correlations verge on the undeniable.
The correlation data is brought together in the following table.
| Figure | Zone | Slope | Intercept | Value of F | |
| Abutting sectors (response to past and present) | A1 | UK | 0.94 | 0.01 | 39 |
| " | A2 | US | 0.87 | -0.06 | 10 |
| " | A3 | EU | 0.94 | -0.01 | 88 |
| Non-abutting sectors (response to past) | A4 | UK | 0.78 | -0.01 | 21 |
| " | A5 | US | 0.74 | 0.00 | 10 |
| " | A6 | EU | 0.71 | -0.01 | 43 |
| Abutting sectors | A7 | ALL | 0.93 | -0.01 | 90 |
| Non-abutting sectors | A8 | ALL | 0.74 | -0.01 | 60 |
| Non-abutting sectors (effect on future) | A9 | UK | 0.68 | -0.03 | 13 |
| " | A10 | US | 0.15 | -0.13 | 2 |
| " | A11 | EU | 0.30 | -0.03 | 3 |
It is the second group of three graphs (in bold) which substantiates the general proposition of this and the previous note. The segments of the 3-month series involved in those graphs no longer abut each other. Each segment terminates before the bank rate change takes place. Here, there is no automatic assurance that the correlation will yield a predictable response of one parameter to the other. For example, if the 3-month rate stayed static from the last bank rate change to the last observation point before the “current” bank rate change, or if it fluctuated randomly with whatever amplitude about some static level during this period, then clearly there would be no correlation whatever. The correlation would be introduced only after the last point of observation, as, according to the conventional story, the 3-month rate jumped or slid into line with the central bank’s lead.
As it is, the tabulated results show very convincing correlations. The pre-observed 3-month changes account on average for three quarters of the subsequent step in bank rate, leaving only one quarter to be accomplished on average either between the last observation and the moment of the bank rate change, or afterwards.
In line with this, it should be noted that the intercepts are all more or less zero. That is, if the perceived pre-history of the 3-month rate is on this measure is unchanging, or fluctuating randomly around a static level, then the central banks would, according to these correlations, make no changes in bank rate. This again is contrary to the conventional story that a group of experts, after careful analysis, announce to a waiting world, the bank rate change which is now to be imposed, in order to restore the economy to health.
It lends weight to my thesis of a process which is pre-determined in a fairly mechanical way that in all three zones, the slopes of the correlations are very close, all within the range 0.74±0.04. This means that three different institutions, with very active teams, according to the usual story, analysing all kinds of economic indicators, are reacting, on average, in exactly the same way to what I would term the "signals" given by the preceding 3-month rate changes.
The data show that all three zones behave in the same way statistically, i.e., on average. But the F-values (which relate to the spread about the average), while indicating reliable correlations in all cases, do seem to show a pecking order in the degree of detailed predictability. If there was total predictability, all points would lie precisely on one fitted curve, R-squared would be unity and F would be infinite. Even if the three central banks are aiming at the same target, it seems that the EU central bank has the least whimsical aim, and the US Federal Reserve the most, with the Bank of England somewhere in between. Be that as it may, a note of caution has to be sounded – all three have four or five instances (out of twenty or thirty) where the bank rate change is of the opposite sign from that of the pre-observed 3-month change.
Figures A7 and A8 merely confirm what is said above. The fact that central banks in all three zones are reacting in the same way to market led changes in the 3-month rate ensures that the F-value in correlation A8, where data for the three zones are amalgamated, is extremely high.
The tabulated results corresponding to Figures A9 to A11 show that for the UK there is a weaker correlation between the present and the future than there was between the past and the present, that is the predictive value of the past 3-month rate change for the current central bank rate change is better than the predictive value of the latter for the future of the 3-month rate. For the US and the EU the effect of the bank rate change of the future short-term rate does not pass the normal tests for a reliable correlation at all, and in the case of the US is hardly perceptible.
The conclusion can only be that by the normal standards of statistical testing (which by their nature must always fall short of proof), the 3-month bank rate leads the changes announced by the central banks in their base rates. It is virtually certain that it is not the other way round, as portrayed in the normal commentary of bankers, politicians, journalists, and for the most part, academic economists.
Walter Stanners, 2002, "The Function of the Central Bank” WoPEc - Working papers in economics