|
|
(1) |
The Size of Employee Stakeholding in Large UK Corporations
Bruce A. Rayton *
and
Jonathan S. Seaton †
October 20, 1998
*
University of BathSchool of Management
Claverton Down
Bath BA2 7AY
United Kingdom
B.Rayton@bath.ac.uk
Voice: +44 1225 323 922
Fax: +44 1225 826 473
†
Department of EconomicsLoughborough University
Loughborough
Leics, LE11 3TU
United Kingdom
J.S.Seaton@Lboro.ac.uk
Voice: +44 150 922 2717
Fax: +44 150 926 9232
Abstract
The existing debate about policies designed to foster the development of a stakeholder economy have largely avoided a fundamental question. How large is the financial stake employees currently hold in their companies? This paper addresses this question using data from the Datastream database, and finds that there is already a significant link between the pay of rank and file employees and the performance of their firms. We find that a doubling of firm value increases employee pay in these firms by approximately 14 percent. Firms with explicit profit-sharing arrangements have a performance elasticity of approximately 0.32, while firms without explicit profit-sharing arrangements have a performance elasticity of only 0.11. This indicates that flexibility of pay is not limited to the explicit profit-sharing awards. This is further substantiated by the finding that even after controlling for the levels of profit-sharing pay, the performance elasticity in the profit sharing firms is 0.27. These estimates are by no means a complete measure of the stakeholding relationship, but they do quantify the financial relationship between firms and a group of primary stakeholders: the workers.
The Size of Employee Stakeholding in Large UK Corporations
[I]t is surely time to assess how we shift the emphasis in corporate ethos - from the company being a mere vehicle for the capital market - to be traded, bought and sold as a commodity; towards a vision of the company as a community of partnership in which each employee has a stake, and where a company's responsibilities are more clearly delineated.
— Tony Blair, Prime Minister of the United Kingdom, January 7, 1996
Stakeholding has received a great deal of attention from the scholarly and popular press. The key thread running through the stakeholding literature is the movement away from the primacy of shareholder interests in determining corporate behavior, and instead focusing on the interdependent interests of shareholders, managers, employees, and society. Buono and Nichols (1990) define a stakeholder as, "any identifiable group or individual who can affect or is affected by organizational performance in terms of its products, policies, and work processes." This definition makes every individual a stakeholder of virtually every corporation. Kay (1996) examines the implications of stakeholder theory, and argues that these ideas require different ways of thinking about corporate governance and regulatory strategies, and that we must consider the way markets function from "a variety of radical perspectives."
This paper fills a gap in the current discussions about the virtues and vices of a stakeholder economy. Existing work largely ignores a fundamental question: How large is the financial stake employees currently hold in the performance of companies? We address this question using eleven years of annual data on average employee pay and common stock returns from 392 firms in the United Kingdom (UK). Market-based performance measures are particularly appropriate because these are the variables of ultimate interest to shareholders.
The focus of this paper on the financial benefits accruing to workers clearly does not capture every element of interest when we speak of stakeholding. Such benefits might include charitable corporate works, the function of local corporations as sources of regional economic stability, or any of a range of other benefits. However, the stakeholder effects for these myriad groups would probably resist analysis with the tools at our disposal. This paper does not pretend to measure these disparate effects. We limit our efforts to measuring the financial stake held by a group of primary stakeholders: the employees.
The evidence presented in this paper is generated using the approach of Rayton (1996, 1997, 1999), and the results indicate that a doubling of firm value generates a 14.4 percent increase in average employee pay. A significant positive pay-performance link appears already to exist for average UK employees, and the magnitude of this link is comparable with the pay-performance link in United States manufacturing firms. This link is also comparable to the link between firm performance and salary-plus-bonus measures of executive pay in US firms. The conclusion of this paper is that although the appropriate degree of stakeholding is an open question, policy prescriptions based on the assumption that employees have no financial stake in firm performance are based on a fallacy.
The existence of incentive payments in an economic model presupposes some violation of neoclassical labor market assumptions. Employees would be paid according to their marginal productivity in a traditional competitive market, but the presence of some sort of imperfection may lead to the need for a link between pay and performance. For example, employees may be highly trained and not replaceable, or there may be non-trivial costs of monitoring employees. We need not settle on a single explanation for stakeholding behavior in order to be interested in an examination of the magnitude of the link.
We examine the link between growth in firm value and growth in pay using the empirical approach used by Rayton (1996, 1997, 1999) to examine a similar link in US manufacturing firms. The primary regression equation is
|
|
(1) |
The dependent variable is the growth of average annual pay, w, for the i’th firm in year t. The primary independent variables are historical growth rates of firm value. These growth rates, r, are defined as the rate of return to common stock. We use growth rates because the influences of time-invariant fixed effects vanish with this specification, and because rates of change are preferable to level changes when firms differ in size. Common stock returns are given by
|
|
(2) |
where pi,t is an annual share price, adjusted for dividends and splits. The lag structure allows two years for returns to alter employee pay. Lagged performance is important because some commonly used forms of pay, e.g., wages and salaries, are not directly linked to performance. These forms of pay can only be adjusted ex post, and annual adjustments of these forms of pay would lead to a link between current pay and lagged performance. The regression coefficients are elasticities, and the sum of the coefficients on firm returns (b 0 + b 1) is a measure of the alignment between shareholder and employee objectives.
The use of firm-level panel data allows the imposition of disaggregated fixed time effects. These dummies (DSIC,t), imposed at the two-digit Standard Industrial Classification (SIC) level, control for industry-specific changes in time-varying omitted variables. We choose to omit the intercept of the regression equation rather than omit one of the dummy variables to simplify the estimation process. This has no effect on the coefficients of interest in this paper.
The fixed effects sweep away the effects of any omitted variable that is either time-invariant, or which varies at (or above) the industry-level of aggregation. This is a deceptively simple way to control for omitted variables. These dummies control for industry-specific technological shocks, industrywide movements in the cost of raw materials, and other time-varying industry-specific variables. The presence of separate time dummies for each industry means the results can not be attributed to any time-varying effects disaggregated to the industry level. The only uncontrolled time-varying shocks remaining are those that are idiosyncratic to individual firms, or those common to sub-groups of firms within an industry.
Abowd (1989) documents the endogeneity of current labor costs and current value. He finds a dollar-for-dollar tradeoff between unexpected changes in collectively bargained labor costs and changes in the value of common stock. In our context, this means that stock market valuations represent firm value after payments to employees. Put differently, stockholders account for existing contractual structures in share valuations, and thus the market restrains adjustments to firm valuations when faced with unexpected performance increases if employment contracts use performance incentives. A simple example clarifies this point. Consider a firm paying performance-based bonuses to employees amounting to the entire effort-based increase in firm performance. The value of this firm remains constant through time if there are no changes in any firm characteristics besides employee performance. The market valuation would never reflect the increases in employee performance because these increases would be matched dollar-for-dollar by increases in current labor costs. Even so, there are significant incentives created by the bonus system, and the failure to recognize this endogeneity would severely underestimate the link between pay and performance. We demonstrate the importance of the endogeneity in an unpublished regression using an ordinary least-squares estimator. The OLS estimate for the impact of contemporary performance on wage growth is an order of magnitude smaller than the two-stage least-squares estimate, and the two estimates are significantly different from each other.
We use two-stage least-squares to correct for this endogeneity, and we take the instruments from a model employed by Bhargava (1994). Bhargava uses changes in sales, historical accounting profit, a binary variable indicating the presence of a profit-sharing system, and industry-specific fixed time effects as the independent variables in a regression on changes in current accounting profit. We draw on Bhargava’s work by using three years of sales growth, two lags of common stock returns, a binary variable indicating the presence of a profit-sharing system, and industry-specific fixed time effects to instrument current period common stock returns. Consistent with Bhargava, we also run some regressions using the level of profit sharing pay to indicate each firm’s profit-sharing status. The use of the continuous profit-sharing variable as an instrument imposes some structure on the relationship between profit-sharing status and the returns to common stock, but it could improve the efficiency of the estimation routine. For this reason we report both sets of estimates.
The empirical model in this paper is a reduced form representation of the link between pay and performance. Industry-specific fixed time effects control for many sources of omitted variable bias, and a vetted model of firm performance controls for the endogeneity of contemporaneous pay and common stock returns. The resulting estimates measure the link between pay and performance in UK firms, and they indicate the size of the stake average employees hold in firm performance.
We chose a set of readily reproducible rules for the construction of our panel. Our panel of firms were those UK quoted companies reporting all major variables cleanly with a one year gap between each accounts issue over the entire period from 1983 to 1993. This reduced the potential sample from over two thousand firms to a balanced panel of nearly four hundred. The data come from Datastream International. The returns data were derived from the dividend adjusted monthly share price index for each firm. We transformed the monthly data into a yearly price index relevant to the months covering each firm’s accounting period. The rest of the data derive from the standard accounts variables in Datastream. Nominal values were adjusted to constant 1987 Pounds Sterling where appropriate, but it is worth noting that the specification of the regression variables in logarithmic changes relegates the effects of any imposed price index to the intercept terms.
Financial markets are notoriously volatile, and regression results can be dramatically affected by a small number of atypical observations. As such, we choose to impose a simple outlier removal algorithm to generate the results of this paper. The outlier removal algorithm is identical to the approach taken in Rayton (1996, 1997, 1999). We remove observations if the value for any regression variable falls below the first percentile or above the ninety-ninth percentile of the available data. This avoids undue impact of atypical observations on the results, and the procedure is completely blind. There is no sense in which the resulting data is "hand-picked." We checked the results of outlier cutoffs ranging from zero (i.e., no outliers removed) to two percent. These variations exert modest influences on the levels of individual point estimates, but the relative magnitudes of the coefficients and the significance levels associated with them remain unchanged. This outlier algorithm is easily reproducible. We settled on the one percent cutoff only because it matches the choices made in other studies.
Column I of Table 1 indicates that there is a significant link between pay and performance in UK firms. Two-stage least-squares results indicate that a doubling in the value of the average firm in the sample results in a 14.4 percent increase in total labor costs per average employee. Rayton (1999) uses the same methods employed in this paper to find an elasticity of approximately 0.1 for US manufacturing firms. Blanchflower, Oswald, and Sanfey (1996), using methods based on fluctuations in accounting profit, report elasticities for US manufacturing firms of approximately 0.08. Our point estimates are somewhat larger than either of these results, but the difference between these coefficients is not statistically significant. Contemporaneous returns drive our results, and this remains even when a second lag of returns is introduced in Column II of Table 1. The picture painted by this data indicates that there is a link between firm performance and employee pay. This creates incentives for employees to increase value.
To examine the question of incentives in more detail, we separate the sample based on profit-sharing status. This allows the examination of the impact of an explicit profit-sharing system on the observed pay-performance relationship. We have no prior convictions for these results. We might expect firms with explicit profit-sharing programs to use relatively stable wages and salaries as a fixed component of pay. Equally, we might expect that those firms with profit-sharing plans reveal themselves to be more suitable for linking pay and performance, and so may have a higher degree of flexibility in all forms of pay. Table 2 examines these results.
There are 335 firms without profit-sharing arrangements. These firms have a significant link between pay and performance, but the point estimate is only 0.11. This is approximately 1/3 the size of the point estimate from the 57 firms that make explicit profit-sharing payments at some point in our sample. The statistical significance of the difference between these estimates is marginal, but the use of the level of profit-sharing pay (see Column II) in the place of the binary profit-sharing indicator (see Column I) yields a 95 percent significance level for the difference between the two groups.
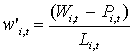
It is no surprise that firms with a portion of pay tied directly to performance have relatively high performance elasticities. Perhaps more surprising is that profit-sharing firms also have a higher elasticity of non-profit-sharing pay. Columns I and II of Table 3 demonstrate this. The dependent variable in these regressions is given by
|
|
(3) |
where L is total employment, W is total labor costs, and P is the level of profit-sharing pay for firm i in year t. This variable can be interpreted as the portion of total pay not delivered to employees through the profit-sharing plan.
The elasticity of non-profit-sharing pay is approximately 0.27 in profit sharing firms, or approximately 2.4 times the performance elasticity of average employee pay in non-profit-sharing firms. This is consistent with the idea that the presence of a profit-sharing plan reveals that there is something different about these firms that makes them better-suited to incentive pay systems. It is not a classic case of an agency contract with fixed and variable components of pay.
Column III of Table 3 further illustrates this point. It presents results based on an even narrower definition of pay. Column 3 reports regressions based on wage and salary data instead of total labor cost. These results indicate an elasticity of 0.31 for profit-sharing firms, as compared with 0.10 for non-profit-sharing firms. Again, the statistical significance of the difference between the profit-sharing and non-profit-sharing estimates is are significant.
Average employees in this sample of publicly traded UK firms currently hold a stake in firm performance, and the size of this stake is comparable to the stake held by average employees of US manufacturing firms. Firms with explicit profit-sharing arrangements exhibit overall performance elasticities of nearly three times the magnitude of non-profit-sharing firms, and also exhibit performance elasticities of non-profit sharing pay that are 2.4 times the magnitude of non-profit-sharing firms. Even so, non-profit-sharing firms have performance elasticites that are significantly different from zero.
Generalization of these results to other groups within the UK economy may be inappropriate. This balanced panel contains only large, mature companies, and no firms enter or exit. Thus one might expect relatively little stakeholding in our group of firms. In this respect, the results are quite startling, but it is unclear if these results are representative of other quoted companies, let alone representative of the rest of British industry.
Even so, this paper demonstrates a link between average employee pay and the equity performance of a balanced panel of major British firms. The appropriate level of stakeholding in the British economy is an open question, but our analysis indicates that a doubling of firm value will eventually result in a 14.4 percent increase in the pay of the average worker. Given this fact, any policy prescription based on the absence of a link between pay and performance is based on a fallacy.
References
Abowd, John M. (1989). "The Effect of Wage Bargains on the Stock Market Value of the Firm." American Economic Review. 79, 774-800.
Alchian, Armen A., and Demsetz, Harold (1972). "Production, Information Costs, and Economic Organization." American Economic Review. 62, 777-795.
Barzel, Yoram (1989). Economic Analysis of Property Rights. Cambridge University Press.
Bhargava, Sandeep (1994). "Profit Sharing and the Financial Performance of Companies: Evidence from U.K. Panel Data." The Economic Journal. 104, 1044-1056.
Blair, Tony (1996). Speech given in Singapore on 7 January, 1996. Published by The Guardian Media Group, <http://www.guardian.co.uk/stakeholder/speech/singlink.html>
Blanchflower, David G., Andrew J. Oswald, and Peter Sanfey (1996). "Wages, Profits, and Rent-Sharing." Quarterly Journal of Economics. 111, 227-252.
Blinder, Alan S. (1990). Paying for Productivity : A Look at the Evidence. The Brookings Institution.
Buono, Anthony F., and Nichols, Lawrence T. "Stockholder and Stakeholder Interpretations of Business' Social Role," in Business Ethics, edited by W. Michael Hoffman and Jennifer Mills Moore (New York: McGraw-Hill, 1990).
Carpenter, Robert E., Fazzari, Steven M., and Petersen, Bruce C. (1994). "Inventory Investment, Internal-Finance Fluctuations, and the Business Cycle." Brookings Papers on Economic Activity." 2, 75-138.
Christofides, Louis, and Oswald, Andrew J. (1992). "Real Wage Determination and Rent-Sharing in Collective Bargaining Agreements." Quarterly Journal of Economics. 108, 985-1002.
Coase, R. H. (1960). "The Problem of Social Cost." Journal of Law and Economics. 3, 1-44.
Coughlan, Anne T., and Schmidt, Ronald M. (1985). "Executive Compensation, Management Turnover, and Firm Performance." Journal of Accounting and Economics. 7, 43-66.
Hildreth, Andrew K. G., and Oswald, Andrew J. (1997). "Wages and Rent-Sharing: Evidence from Company and Establishment Panels." Journal of Labor Economics. 15, 318-337.
Holmstrom, Bengt (1982). "Moral Hazard in Teams." Bell Journal of Economics. 13, 324-340.
Jensen, Michael C., and Murphy, Kevin J. (1990). "Performance Pay and Top Management Incentives." Journal of Political Economy. 98, 225-264.
Kay, John (1996). The Business of Economics. Oxford University Press.
Kruse, Douglas L. (1993). Profit Sharing: Does it Make a Difference. W.E. Upjohn Institute for Employment Research.
Rayton, Bruce A. (1995). "The CEO is Not the Only Employee of the Firm: An Empirical Investigation of Firm-Level Pay-Performance Relationships." Ph.D. dissertation, Washington University.
––– (1996). "Firm Performance and Compensation Structure: Performance Elasticities of Average Employee Compensation." Working Paper, Nottingham Trent University.
––– (1997). "Rent-Sharing or Incentives? Estimating the Residual Claim of Average Employees." Applied Economics Letters, volume 4, issue 12, 725-728.
––– (1999) "The Residual Claim of Rank and File Workers." Journal of Corporate Finance. Forthcoming.
Williamson, Oliver E. (1985). The Economic Institutions of Capitalism. The Free Press.
TABLE 1
Results for the full sample
:Two-stage least-squares regressions including industry-year fixed effects.
T-statistics in parentheses.
|
I |
II |
||
|
Per-employee total labor costs as dependent variable.
Instruments include binary profit-sharing variable |
Per-employee total labor costs as dependent variable.
Instruments include binary profit-sharing variable |
||
|
Number of firms |
392 |
392 |
|
|
Sample size |
2820 |
2820 |
|
|
Number of dummy variables |
332 |
332 |
|
|
Return to Common Stock (t) |
0.141541 |
0.142060 |
|
|
(4.76) |
(4.77) |
||
|
Return to Common Stock (t-1) |
0.002428 |
0.002374 |
|
|
(0.43) |
(0.42) |
||
|
Return to Common Stock (t-2) |
-0.004458 |
||
|
(-0.75) |
|||
|
Estimated performance elasticity |
0.143969 |
0.139976 |
|
|
* |
T-Statistic for coefficient sum > 0 |
(4.77) |
(4.57) |
TABLE 2
Results separated by profit-sharing status
:Two-stage least-squares regressions including industry-year fixed effects.
Fixed effects imposed separately for each profit-sharing class.
T-statistics in parentheses.
|
I |
II |
||
|
Per-employee total labor costs as dependent variable.
Instruments include binary profit-sharing variable. |
Per-employee total labor costs as dependent variable.
Instruments include continuous profit-sharing variable |
||
|
Number of non-profit-sharing firms |
335 |
335 |
|
|
Number of profit-sharing firms |
57 |
57 |
|
|
Sample size |
2811 |
2811 |
|
|
Number of dummy variables |
462 |
462 |
|
|
a |
Return to Common Stock (t) |
0.105375 |
0.105375 |
|
(3.32) |
(3.31) |
||
|
b |
Return to Common Stock (t-1) |
0.004087 |
0.004087 |
|
(0.68) |
(0.67) |
||
|
c |
D*[Return to Common Stock (t)] |
0.205054 |
0.220238 |
|
(1.98) |
(2.06) |
||
|
d |
D*[Return to Common Stock (t-1)] |
0.006184 |
0.006831 |
|
(0.28) |
(0.31) |
||
|
a + b = |
0.109462 |
0.109462 |
|
|
* T-Statistic for a + b > 0 |
(3.46) |
(3.44) |
|
|
a + b + c + d = |
0.320700 |
0.336531 |
|
|
** T-Statistic for a + b + c + d > 0 |
(3.06) |
(3.11) |
|
|
*** T-Statistic for c + d > 0 |
(1.93) |
(2.01) |
TABLE 3
Results based only on non-profit-sharing pay
:Two-stage least-squares regressions including industry-year fixed effects.
Fixed effects imposed separately for each profit-sharing class.
T-statistics in parentheses.
|
I |
II |
III |
||
|
Per-employee total labor costs (less profit-sharing) as dependent variable.
Instruments include binary profit-sharing variable. |
Per-employee total labor costs (less profit-sharing) as dependent variable.
Instruments include continuous profit-sharing variable |
Per-employee wage and salary data as dependent variable.
Instruments include binary profit-sharing variable |
||
|
Number of non-profit-sharing firms |
335 |
335 |
334 |
|
|
Number of profit-sharing firms |
57 |
57 |
57 |
|
|
Sample size |
2811 |
2811 |
2797 |
|
|
Number of dummy variables |
462 |
462 |
462 |
|
|
a |
Return to Common Stock (t) |
0.105375 |
0.105375 |
0.097548 |
|
(3.37) |
(3.33) |
(3.13) |
||
|
b |
Return to Common Stock (t-1) |
0.00487 |
0.00487 |
0.003874 |
|
(0.69) |
(0.68) |
(0.66) |
||
|
c |
D*[Return to Common Stock (t)] |
0.157311 |
0.194232 |
0.207788 |
|
(1.54) |
(1.83) |
(2.05) |
||
|
d |
D*[Return to Common Stock (t-1)] |
0.002461 |
0.004035 |
0.005619 |
|
(0.11) |
(0.18) |
(0.25) |
||
|
a + b = |
0.109462 |
0.109462 |
0.101422 |
|
|
* T-Statistic for a + b > 0 |
(3.50) |
(3.47) |
(3.25) |
|
|
a + b + c + d = |
0.269234 |
0.307729 |
0.314829 |
|
|
** T-Statistic for a + b + c + d > 0 |
(2.60) |
(2.87) |
(3.03) |
|
|
*** T-Statistic for c + d > 0 |
(1.48) |
(1.77) |
(1.97) |
TABLE 4
Results separated by profit-sharing status
:Two-stage least-squares regressions including industry-year fixed effects.
Fixed effects imposed separately for each profit-sharing class. T-statistics in parentheses.
|
I |
II |
||
|
Independent variables |
Separated by profit-sharing status: Per-employee total labor costs as dependent variable.
Instruments include binary profit-sharing variable. |
Separated by profit-sharing status: Per-employee total labor costs as dependent variable.
Instruments include continuous profit-sharing variable. |
|
|
Number of non-profit-sharing firms |
335 |
335 |
|
|
Number of profit-sharing firms |
57 |
57 |
|
|
Sample size |
2811 |
2811 |
|
|
Number of dummy variables |
462 |
462 |
|
|
Return to Common Stock (t) |
0.107622 |
0.107622 |
|
|
(3.39) |
(3.38) |
||
|
b |
Return to Common Stock (t-1) |
0.004030 |
0.004030 |
|
(0.67) |
(0.66) |
||
|
c |
Return to Common Stock (t-2) |
-0.007987 |
-0.007987 |
|
(-1.28) |
(-1.282) |
||
|
d |
D*[Return to Common Stock (t)] |
0.189661 |
0.206250 |
|
(1.73) |
(1.81) |
||
|
e |
D*[Return to Common Stock (t-1)] |
0.005844 |
0.006526 |
|
(0.27) |
(0.30) |
||
|
f |
D*[Return to Common Stock (t-2)] |
0.016312 |
0.015003 |
|
(0.67) |
(0.61) |
||
|
a + b + c = |
0.103665 |
0.103665 |
|
|
* T-Statistic for a + b + c > 0 |
(3.25) |
(3.23) |
|
|
a + b + c + d + e + f = |
0.315482 |
0.331444 |
|
|
** |
T-Statistic for a + b + c + d + e + f > 0 |
(2.99) |
(3.03) |
|
*** T-Statistic for d + e + f > 0 |
(1.92) |
(2.00) |
TABLE 5
Non-Profit-Sharing Firms:
Means and medians of selected firm characteristics.
Sterling figures presented in constant 1987 Pounds Sterling.
335 firms
|
Characteristic |
Mean |
Median |
|
Total number of employees |
8,940.64 |
1,506.00 |
|
Total labor costs |
94,521.80 |
15,204.31 |
|
Annual per-employee pay |
10,749.53 |
10,427.93 |
|
Growth of annual pay (percent) |
2.38 |
2.17 |
|
Returns to common stock (percent) |
6.46 |
8.34 |
|
Level of total profit-sharing pay |
------ |
------ |
|
Sales |
556,945.10 |
70,381.05 |
|
Sales Growth |
3.62 |
2.71 |
TABLE 6
Profit-Sharing Firms:
Means and medians of selected firm characteristics.
Sterling figures presented in constant 1987 Pounds Sterling.
57 firms
|
Characteristic |
Mean |
Median |
|
Total number of employees |
13,097.80 |
1,375.00 |
|
Total labor costs |
102,876.4 |
12,760.30 |
|
Annual per-employee pay |
10,315.54 |
10,128.56 |
|
Growth of annual pay (percent) |
2.10 |
2.08 |
|
Returns to common stock (percent) |
7.20 |
7.71 |
|
Level of total profit-sharing pay |
1,574.36 |
52 |
|
Sales |
684,225.10 |
70,725.63 |
|
Sales Growth |
2.83 |
2.85 |
TABLE 7
All Firms:
Means and medians of selected firm characteristics.
Sterling figures presented in constant 1987 Pounds Sterling.
392 firms
|
Characteristic |
Mean |
Median |
|
Total number of employees |
9,521.85 |
1,485.00 |
|
Total labor costs |
95,689.84 |
14,607.22 |
|
Annual per-employee pay |
10,688.85 |
10,402.65 |
|
Growth of annual pay (percent) |
2.34 |
2.16 |
|
Returns to common stock (percent) |
6.57 |
8.29 |
|
Level of total profit-sharing pay |
220.11 |
0.00 |
|
Sales |
574,739.90 |
70,402.86 |
|
Sales Growth |
3.51 |
2.72 |