HEROIC PLANTS
PERSISTENTLY-RAPID JOB CREATORS IN THE LONGITUDINAL RESEARCH DATABASE - THEIR DISTINGUISHING CHARACTERISTICS AND CONTRIBUTION TO EMPLOYMENT GROWTH
Nathan Musick
Email:
nmusick@doc.gov
The research in this paper was conducted while the author was a research associate at the Center for Economic Studies, U.S. Bureau of the Census. Research results and conclusions expressed are those of the author and do not necessarily indicate concurrence by the Bureau of the Census or the Center for Economic Studies.
Table of Contents
SUMMARY 1INTRODUCTION *
Micro-level Persistence and Aggregate Economic Change: Are There Heroic Plants?
*Heroic Plant Research in the Context of Earlier Literature on Plant and Firm Growth
*I. DATA AND METHODOLOGY FOR IDENTIFYING HEROIC PLANTS *
Data Sources
*Models of Establishment Growth
*i. The Need to Control for Age and Size
*ii. Advanced Technology Use and Growth Persistence
*Method of Analysis
*II. Results *
Results from Growth Regressions
*Heroic Plant Employment Trends
*Heroic Plant Characteristics
*i. Heroic Plant Manufacturing Process, Product Markets Served, and Product Price
*ii. Heroic Plant Characteristics from the LRD
*Heroic Plant Advanced Technology Use
*CONCLUSIONS *
APPENDIX: COMPLETE PLANT CHARACTERISTICS REGRESSIONS *
Bibliography *
LIST of Tables
Table 1 Distribution of Sample Plants Across Employment Size Classes, 1977 - 1992…………………
*Table 2
Results from Employment Growth Regressions, 1977-1982 and 1982-1987…………………….. *Table 3
Distribution of Heroic and Sample Plants Across Select Control Variables in Growth Equations1987: Date of Plant Birth; Standard Industrial Classification; Share of Plant Shipments Sent
Directly to Defense Agencies; and Ownership by a Multi-Plant Firm……………………… *
Table 4
Employment Trends for the Sample and for Heroic Plants, 1977-1992…………….…………… *Table 5
Distribution of Heroic Plants Across the Small Business Administration’s Small and LargeSmall and Large Size Classes, 1977 - 1992…………………………….……………………… *
Table 6
Distribution of Sample and Heroic Plants Across Various Establishment Characteristics:Characteristics: Type of Manufacturing Process, Market for Plant Production; and
Average Price of Plant Products……………………………………………………………….. *
Table 7
Classifying the Duration and Rapidity of Plant Growth, 1977-1987…………….……………… *Table 8
1977 Characteristics of Heroic and Other Plants Displaying Exceptional Employment GrowthAcross 1977-1987…………………………………………………………….………………... *
Table 9
1977 Gross Investment Ratios of Heroic and Other Plants Displaying Exceptional EmploymentGrowth Across 1977-1987……………………………………………………………………... 32
Table 10 1987 Characteristics of Heroic and Other Plants Displaying Exceptional Employment Growth
Across 1977-1987…………………………………………………………….………………... 35
Table 11 Employment Growth Status and Advanced Technology Use in 1988…………………………... 39
Heroic Plants are Important to Overall Job Creation...
‘Heroic Plants’ are defined in this study as establishments in technology-intensive capital goods industries (SICs 34-38) whose employment growth, after factoring out the influence of well-known determinants of plant expansion such as age, size, industry, etc., ranks in the top quarter of growth rates from both the 1977-1982 and 1982-1987 periods. These plants account for roughly 25% of total job creation by establishments operating throughout this time. Heroic Plants’ contribution to overall employment growth is thus roughly four times larger than their share of employment at any time within the sample.
…and Their Success Appears Due to Plant-Specific Rather than Sectoral Factors.
While Heroic Plants tend to participate in growing sectors of the economy (favoring, for example, commercial over industrial product markets), they are nonetheless active in a variety of product markets, manufacturing processes and price ranges.
Also, in spite of the difficulties in measuring performance characteristics using time-series data, these plants display numerous characteristics of successful establishments. For example, when their exceptional growth begins to be tracked in 1977, these plants are more capital intensive and productive, and they pay higher wages, than do plants whose growth will be less rapid and/or persistent during the next decade. They also distinguish themselves by larger gross investment ratios (relative either to their current employment, value added or capital stock).
In 1987 (the endpoint of establishment growth tracking), Heroic Plants display higher labor productivity than do other plants, in spite of their labor-intensive operations. These exceptional job creators also share with other persistent (although less rapid) growers an above-average tendency to use advanced technologies in 1988. Finally, Heroic Plants pay lower average wages to production workers than do other plants, raising questions about the division of returns to, as well as the relative contributions of, owners, management and workers in highly successful businesses.
The Existence and Significance of Such Exceptional Performers Could Have Important Policy Implications….
Results from this study suggest that, beyond the amount of capital plants have, the way capital is used makes an important contribution to labor productivity. This finding echoes a conclusion from the McKinsey Institute’s recent international comparison of productivity levels. Hence, an alternative policy to relying on cuts in capital gains to stimulate growth might be to disseminate, to the extent possible, the ‘best-practice’ of successful establishments. However, because the present study’s findings are only suggestive, conclusions about those factors responsible for persistent establishment performance differences await the outcome of future research.
…after Further Research Provides a More Complete Picture of Economic ‘Heroism’.
One immediate next step is to assess Heroic Plant performance relative to traditional targets for government policy. For example, how much of a role do industry affiliation and geographic location play in sustained plant growth? Indeed, are Heroic Plants found in all industries, or is this phenomenon limited to the technology-intensive sectors considered by this study? The answer to these questions would provide an indication of the potential return from reorienting policy away from industry-wide or regional programs towards more establishment-level ones.
Secondly, research must determine whether the plant or the firm is the appropriate object for policy. That is, are there ‘Heroic Firms,’ and if so, how do they compare, in terms of both their contribution to employment growth as well as their distinguishing characteristics, with the Heroic Plants discussed above?
Finally, what are the factors contributing to the exceptional performance identified by this study, and which policy could foster? One way of addressing this issue would be to initiate a survey for data on, say, product innovation, business strategy and management techniques, as collected now by Statistics Canada. However, much can also be done with data already available.
For example, it would be interesting to compare the present results with those from analyzing a cohort of plants and/or firms, i.e., a sample of businesses that began operation at the same time. This would allow business failure to be taken into account when considering exceptional performance and the factors contributing to it.
Further, one might explore the sources of superior performance by asking whether multi-unit firms grew by expanding within industries or across them, and whether plants associated with these firms compared favorably to other plants in the relevant industries. Such results would indicate the degree to which exceptional business growth was due to particular production techniques (which would tend to be industry-specific), as opposed to organizational attributes (which could be more applicable across industries).
Micro-level Persistence and Aggregate Economic Change: Are There Heroic Plants?
This study of exceptional plant performance is part of a continuing effort by the Office of Policy Development, Department of Commerce, to understand the factors that influence economic growth and change. Broadly speaking, changes in the aggregate economy may be traced to three sources: (i) changes in conditions common to all industries and firms (e.g., economic institutions, resource endowments, key technologies, etc.); (ii) changes in the distribution of economic activity across sectors and industries; (iii) evolving performance differences among plants and firms within a given industry.
Previous work with longitudinal Census data illustrates the importance of the last, micro-level source of economic change. This research shows, firstly, that performance differences between individual establishments persist over time, and account for an important share of observed trends in aggregate economic behavior. Secondly, studies using micro-level data find that establishment performance is largely unexplained by observable characteristics such as age, size, industry, region, ownership status, etc. Several notable examples from this literature are discussed next.
For example, a productivity analysis by Baily, Hulten and Campbell (1992) finds persistent productivity differentials across manufacturing plants. These authors also show that intra-industry shifts in output shares, from establishments of lower to higher productivity, are an important determinant of overall industry productivity growth. Plant entry and exit contributes little to overall trends. Baily, Hulten and Campbell interpret all these results as being "consistent with the idea of well-managed plants that are able to stay on top for long periods," p. 189. Examining textile industries, Dwyer (1996) estimates that persistent productivity differentials account for about half of the plant-level variation in productivity.
Considering plant exporting, Bernard and Jensen (1997) find that successful exporters account for a sizable share of emerging trends observed in manufacturing overall: the shift from production to non-production workers, and the ‘wage-gap’ between skilled and non-skilled workers.
Davis, Haltiwanger and Schuh (1996) paint a similar picture for employment. They find large levels of within-industry job creation and destruction which, at the respective plants, tend to persist for at least two years. Both these authors as well as Leonard (1987) show that this activity is highly concentrated in plants with large percentage increases and decreases in employment. Thus, industry employment tends to shift, at least during two-year intervals, from less- to more-successful plants.
Additionally, the factors contributing to establishment success in each of the preceding cases, remain largely unidentified.
For instance, both the study by Baily, Hulten and Campbell (1992) cited above as well as a productivity analysis by Baily, Bartelsman and Haltiwanger (1992) find that establishment characteristics such as size, age, industry and region fail to explain most inter-plant productivity differences. Both sets of authors conclude that superior productivity performance must be due to unobservable or ‘idiosyncratic’ establishment attributes such as management and/or workforce ability. Bernard and Jensen (1995) demonstrate that, while exporters tend to be successful plants, exporting is a poor indicator of future success. Thus, exporting alone is not an explanation for relative plant performance. In an extension of the above-cited work on employment, Davis and Haltiwanger (1992) find that many of the plant characteristics listed above explain little of the employment shifting from declining to growing establishments. Finally, empirical studies of the determinants of individual plant and firm employment growth (see the relevant citations given later in this chapter) rarely explain more than 15% of its variance across establishments.
The present research attempts to learn more about how persistent inter-plant performance differences contribute to shaping aggregate economic outcomes. Specifically, this study identifies a select group of exceptional job creators (‘Heroic Plants’), and investigates both these plants’ importance to aggregate totals over time, as well as the characteristics that distinguish such plants from other establishments. By extension, it hopes as well to learn more about the nature of successful performance in the overall sample. Thus, this study asks two basic questions:
The next section discusses how answers to these two questions would contribute to the existing literature on plant and firm employment growth.
Heroic Plant Research in the Context of Earlier Literature on Plant and Firm Growth
Before comprehensive plant- and firm-level time-series data became available, researchers looked to industry establishment-size distributions to infer the process of plant and firm growth. For instance, Simon and Bonini (1958) and Ijiri and Simon (1964, 1967) explain observed industry establishment-size distributions by invoking a stochastic process of establishment growth known as Gibrat’s Law. This states that plant and firm growth rates should be independent of size.
Longitudinal data allow for a more penetrating examination of the factors influencing establishment growth. Notable early examples of this literature, which focus on the correlation of growth rates with both establishment age and size, are Evans (1987a, 1987b), Hall (1987), Leonard (1987) and Dunne, Roberts and Samuelson (1989a, 1989b). Subsequent research has expanded this set of explanatory factors to include, along with the other standard establishment characteristics cited above, advanced technology use, exporting, ownership change and unionization.
Another branch of the economics literature takes a broader approach to understanding establishment growth. Such theory differs from the preceding literature in that it does not attempt to link observed establishment-specific attributes to growth. Instead, it considers how aggregate industry employment changes would look when those factors influencing such changes were distributed in a certain way across establishments. For example, Hamermesh (1993), Caballero and Engel (1993) and Caballero, Engel and Haltiwanger (1997) model how plants decide to alter their employment when such changes bring with them disproportionate costs of adjustment. In these models, employment changes take place when a plant’s desired level of employment deviates, either by a sufficient amount or for a long enough period of time, from its actual level. While plants are assumed to be heterogeneous in their propensity to change their employment at any time, the sources of this heterogeneity are not explicitly modeled and the process which calls forth employment changes is assumed to be exogenous to all plants. Such models have shown themselves to be particularly useful in understanding how micro-level adjustments can lead to the aggregate employment changes associated with cyclical trends in economic activity (see Davis and Haltiwanger (1992) and Caballero and Engel (1993)).
The present research extends this literature on establishment employment growth in several ways.
First, heroic plant research investigates the growth of individual establishments over a much longer period (10 years) than do most earlier studies. By so doing, it sheds light on the importance of fairly long-lived intra-industry shifts, in establishment employment, from less- to more-successful plants.
Secondly, this study measures plant growth performance somewhat differently than does previous research. A ten-year period encompasses two successive Census of Manufactures (COM) panels. To identify Heroic Plants, this study does not measure the simple rate of plant employment growth across the entire ten-year period, but instead considers the persistence of a plant’s high growth rate in each of the two five-year intervals. This shift of focus, from cumulative growth across some period to the persistence of growth within that period, may exclude some exceptional job creators. For instance, there may be some short-term growers whose spurts of rapid employment gains leave them with a higher cumulative rate of job creation at the end of the ten-year period, than is true for more persistent quinquennial growers. However, such plants should be few. On the other hand, results from characteristics regressions later in the paper show that a classification of plants by both the persistence and magnitude of their growth, can provide insights into the sources of sustained job creation not identified by earlier studies.
Thirdly, by focusing on a small group of successful establishments, heroic plant research resembles that of Baldwin et. al. (1994). Indeed, the results presented below point to similarities across the groups of exceptional performers identified by each study. However, the present research links its results much more closely to existing theory on establishment growth than do Baldwin et. al. In addition, heroic plant research evaluates superior performance not just in an absolute sense, as do these authors, but also with respect to its importance to aggregate trends. Previous literature suggests that this additional perspective is important. For example, Davis, Haltiwanger and Schuh (1996) find that plants displaying above-average percentage increases in employment account for disproportionate shares of job creation.
Finally, the research at hand does not attempt to unify micro and macro outcomes in such a global and formal way as do the adjustment-cost models discussed above. Nonetheless, by focusing on a select group of establishments, heroic plant research hopes to understand better the determinants of plant employment growth among a more comprehensive set of establishments.
I. DATA AND METHODOLOGY FOR IDENTIFYING HEROIC PLANTS
The sample of plants used by this study is a subset of establishments included in the 1988 Survey of Manufacturing Technology (SMT). This study’s sample is comprised of the 4,776 SMT 1988 establishments that remained in operation between 1977 and 1992. Information on type of production process, price and market for plant products and shipments to defense agencies comes from the SMT. Data on all other plant characteristics are obtained from the Census of Manufactures (COM).
The SMT 1988 contains observations taken mostly from SIC’s 34-38. The 1987 COM reports that these 5 industries accounted for 43 percent of employment and 39 percent of value of shipments in manufacturing in 1987. Employment trends in these industries mirror those for manufacturing overall.
While restricted to SMT establishments that stay in business from 1977 onwards, this study’s sample does generate results similar to other studies using a more comprehensive selection of 1988 SMT data (see Dunne and Schmitz (1991), Doms, Dunne and Roberts (1994), McGuckin, Streitweiser and Doms (1995) and Jensen and Musick (1996). Throughout the 1977-1992 period, this study’s sample never accounts for less than about two-thirds of employment of all plants in the 1988 SMT.
The present dataset is especially attractive in that it offers the chance to explore the links between advanced technology use and persistently-rapid employment growth. However, some features of these data require special attention when investigating plant growth. In particular, the 1988 SMT placed no restrictions on the age or size of plants that could be surveyed. Most empirical studies find that age and size are negatively correlated with establishment growth rates.
Consequently, unless this study restricts itself to a group of plants of the same age and initial size (thereby also discarding most observations from the dataset), its selection of establishments that display heroic percentage growth must control for both these establishment characteristics. Not doing so would risk simply replicating earlier research, and thereby make more difficult obtaining new insights into the plant attributes that determine rates of growth.
Economic theory offers several models that explore why establishment age and size should influence growth in ways consistent with the empirical literature cited above. Thus, heroic plant research can invoke these models’ predictions both to accommodate the peculiarities of the data available to it, as well as to assess its results with a view to fleshing-out existing theory.
The following sections briefly present these models of establishment growth, arguing in particular how other plant characteristics such as advanced technology use, may find a place in them.
Models of Establishment Growth
i. The Need to Control for Age and Size
The models of Jovanovic (1982) and Pakes and Ericson (1989) offer explanations for the association between establishment growth, age and size which rest on maximizing behavior and industry equilibrium, and also incorporate establishment heterogeneity, learning and the stochastic nature of investment and innovation projects.
In the Jovanovic model, plants differ in the efficiency with which they produce a homogeneous product. Efficiency in each period is determined by a plant-specific endowment, assumed not to change over time, and a temporal disturbance which is uncorrelated and on average equals zero. When plants begin production, they do not know with certainty their true efficiency: they only have an estimate of its value, which determines whether they begin production or not. In each period plants compare their actual profits with what they would have earned had their current belief about their true efficiency been correct. Because plant efficiency is subject to a random shock each period, it takes time for plants to distinguish between their true and spurious efficiency levels. As a consequence, over time plants continually update their estimate of their own efficiency, and make subsequent output decisions accordingly.
As establishments thus adjust their production in response to market signals, one finds that more efficient establishments increase their output (and hence grow), while less efficient ones reduce their production and either decline or go out of business altogether.
Jovanovic’s model also has implications for how establishment age and size should influence relative growth rates. Jovanovic places upper and lower bounds on plant efficiency. Thus, no plant can become infinitely large or small. This implies that, for a group of similarly-sized plants, the larger are these plants then the smaller (on average) should be their potential growth. Also, the older a plant is the better it knows its true efficiency. Consequently, changes in establishment size should also become smaller as plants age, with older survivor plants growing more slowly than younger ones.
Pakes and Ericson (1989) propose an alternative model of establishment. Note that, in Jovanovic’s model, establishments are basically passive, acting in response to market signals. They do not, through either product or process innovation, try to create new markets or influence the nature of existing ones. Pakes and Ericson (1989) investigate how outcomes from a Jovanovic-style model of ‘passive learning’ would differ from results generated by a model allowing for ‘active exploration’ of investment/innovation opportunities. As Pakes and Ericson formulate the latter model, successful investment or innovation leads to expansion; while unsuccessful efforts lead to decline. Although the likelihood of a favorable return from such projects increases with the amount of resources allocated to them, success is not guaranteed. Thus, establishment size can rise or fall as a result of active exploration.
Pakes and Ericson specify two models, one for each set of assumptions discussed above, and focus on fundamental differences between the growth process of passive and active behavior. These authors find that both types of models generate results broadly consistent with those of Jovanovic.
For example, and similarly to Jovanovic, in both the passive and active scenarios Pakes and Ericson impose bounds on potential plant size. Thus, current size and growth rates should be negatively related for both passive learners and active explorers. However, Pakes and Ericson demonstrate that the empirically-found negative relationship between age and establishment growth is inherent in neither passive learning nor active exploration processes (at least in their ‘bare-bones’ formulation of them), but instead depends on additional assumptions made to flesh out these models.
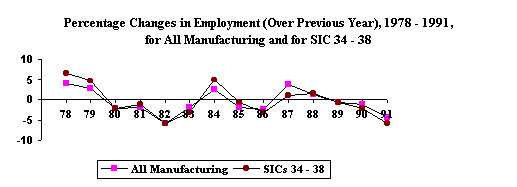
The models of Jovanvic, and Pakes and Ericson, are arguments for persistent establishment growth: good plants, through either passive learning or active exploration, prosper over time. The growth process posited by these models is seen in employment data for this study’s sample of ‘good’ plants, i.e., plants that remain in business from 1977 to 1992. Table 1 shows that, over this period, there is in general a steady migration of establishments from the smaller to larger size classes. This occurs in spite of the fact that, from 1977 to 1992, yearly aggregate employment growth rates for these industries (including start-ups and failures in addition to survivor plants) were regularly at or below zero (see earlier graph).
|
Distribution of Sample Plants Across Employment Size Classes, 1977 - 1992 |
||||||
|
Number of Employees |
Share of Plants in Size Class Each Year |
|||||
|
1977 |
1982 |
1987 |
1992 |
D 77-92 |
||
|
1-99 |
43.9 |
41.2 |
37.1 |
39.7 |
- 10% |
|
|
100-249 |
22.0 |
23.4 |
26.7 |
26.2 |
19% |
|
|
250-499 |
13.9 |
14.4 |
14.8 |
15.9 |
14% |
|
|
500-999 |
10.2 |
11.2 |
12.5 |
11.1 |
9% |
|
|
1000-2499 |
6.5 |
6.7 |
5.9 |
5.0 |
- 23% |
|
|
2500+ |
3.5 |
3.1 |
2.9 |
2.2 |
- 37% |
|
|
Total |
100.0 |
100.0 |
100.0 |
100.0 |
||
Finally noteworthy in these models is the possibility that persistently-superior establishment performance (relative to other establishments of the same age and size) is merely the product of chance. For instance, because of the temporal disturbance in the Jovanovic model, an establishment of a given age and size can grow faster than its true efficiency would warrant, merely because it fortuitously received a series of exceptionally-favorable, but inaccurate, production shocks. Ericson and Pakes’ model also allows a spurious component to plant growth. Thus, there is the possibility that persistent plant growth over some period is not related to true plant quality, but due rather to a sequence of random events.
In light of what is already known about establishment growth, the goal of heroic plant research is thus two-fold: firstly, to identify establishments whose employment growth is persistently larger than what one would expect from the growth dynamics conditioned by plant age and size; and secondly, to try to infer, from observable establishment features, plausible plant-specific sources of persistently-rapid growth. The following paragraphs argue why advanced technology use might be counted among such characteristics.
ii. Advanced Technology Use and Growth Persistence
In the context of the theory described above, there are several ways in which advanced technology use could contribute to persistently-superior establishment performance. For instance, good plants can use advanced technologies to become more productive. Alternatively, applying new technologies can allow good plants to become more innovative. Thus, good plants using advanced technologies might increase their share of existing markets, and/or expand into new ones. As a consequence, advanced technology users may over time attain larger employment levels and, by extension, display higher rates of growth, than competitors currently of a comparable age and size. As noted above, previous studies have found a positive association between advanced technology use and establishment growth (see Doms, Dunne and Roberts (1994), Beede and Young (1996) and Jensen and Musick (1996)). This study will view plant growth from a somewhat different perspective than earlier research, and by thus distinguishing between short- and longer-term growth, explore the degree to which advanced technology use and exporting are correlated, after controlling for age and size, with persistently-rapid establishment growth.
One consideration in interpreting such results (from either this or earlier studies) is the possibility that advanced technology use may, beyond contributing directly to plant performance, be proxying for other, unmeasured establishment characteristics which also contribute to plant growth. For instance, because advanced technology use is a demanding activity, and is thus undertaken most often by large and/or well-operating plants (see Davies (1979)), a correlation between this variable and plant performance may also reflect the presence of normally unobservable plant attributes such as management and workforce quality (for results in this vein see Doms, Dunne and Troske (1996), who exploit an unusually rich dataset on worker characteristics). Also, advanced technology use may be a sign not just of plant technological sophistication, but of innovative efforts in general. For instance, Dunne (1994) shows that use of some advanced technologies by plants belonging to multi-plant firms, is correlated with firm R&D spending. Hall (1987) finds that per-employee R&D spending is positively correlated with firm growth, while Mansfield (1962) similarly finds that firms which introduce a product innovation subsequently grow faster than those who do not.
Regardless of the various interpretations attaching to it, plant advanced technology use is an important additional source of information for inferring the determinants of inter-plant growth differences.
Given the above considerations, this study proceeds as follows:
A few aspects of each step above merit further discussion here.
Step 1
Measuring Growth Rates
In regressions to factor out the influence of standard explanatory variables on plant employment growth, this study expresses establishment growth rates as the change in plant employment divided by the plant’s average employment during the interval in question. (In contrast, all statistical tables in this study report growth rates in which the denominator is plant employment at the beginning of the period). Using this measure, the parameters of growth regressions are quite stable with respect to the addition or omission of outliers, i.e., observations displaying unusually high or low growth. Thus, after inspection for plausibility, this study can consider the entire spectrum of establishment growth rates without qualms about robustness of the estimation results used to rank residual plant growth. Also, this growth measure is a monotonic transformation of the more standard growth rate (change over initial value), and so for ranking purposes preserves initial inter-plant differences in growth. Finally, employment rates measured from the interval mean are symmetrically distributed rather than sharply skewed and truncated at -1, as is the case for standard growth rates. Thus, for establishing the statistical significance of estimated coefficients of explanatory variables, interval-mean growth rates may correspond more closely to assumptions made in applying the linear regression model (see Dunne, Roberts and Samuelson (1989a, pp. 685-86)).
Step 2
The Time Horizon for Judging Growth Persistence
Adopting a ten-year horizon (or two 5-year intervals: 1977-1982 and 1982-1987) turns out to be the most feasible approach. Given the current sample size, ranking plants over a longer time span (say, 1972-1987) would leave an uncomfortably small number of plants in each heroic group. While two periods is the minimum number for judging persistence, to assess the robustness of the resulting selection of Heroic Plants this study also considers plant employment share in the ‘out of sample’ period 1987-1992. In this regard it should be noted that the 1992 Census data used here are at a preliminary stage of processing.
Step 3
Using a Sample of Survivor Plants
Finally worthy of note is the impact of using a sample of survivor plants (i.e., plants that stay in operation across 1977-1992) on results for the characteristics of Heroic Plants. Because of this, the regression analyses to determine the impact of these characteristics may understate the impact of potential explanatory variables on relative plant performance. This can occur when the explanatory (or independent) variables of interest are also correlated with the mechanism selecting establishments into the sample, i.e., in this case, with survival (for an example of advanced technology use’s correlation with plant survival see Doms, Dunne and Roberts (1995) and Jensen and Musick (1996)). However, for such a downward bias to occur the cumulative impact of other unidentified factors in the analysis must also operate on plant survival and performance in the same way. Heroic plant research has not yet investigated this issue, and it would be useful to extend the current work to datasets of surviving and failing plants.
Results from Growth Regressions
Table 2 reports coefficient estimates from employment growth regressions for 1977-1982 and 1982-1987. Corresponding to findings from the earlier studies cited above, age and size are generally negatively correlated with plant employment growth.
Note that age differences are more important for plant growth in 1977-1982 than 1982-1987. This is likely due to the sample being restricted to plants that start up by 1977. Because of this restriction, inter-plant age differences diminish (in percentage terms) as one moves from the first to the second 5-year interval.
In each 5-year interval of the 1977-1987 period, at least one group of plants sending shipments directly to defense agencies in 1988 registers considerably higher growth rates than do those plants reporting no direct shipments at all. Assuming that establishment defense activity in 1988 reflects these plants’ customer orientation earlier in the decade, these results are generally consistent with other estimates of the employment effects of increased defense spending.
Interestingly, apparent employment boosts from defense spending are not consistent across intervals. For 1977-1982, the job growth premia associated with plants’ direct shipments to defense agencies rise steadily as these shipments account for larger shares of total establishment production. However, across 1982-1987 it is only the most intensive defense suppliers (76 to 100 percent of plant shipments going directly to defense agencies) which enjoy a defense-related premium for employment growth. Because defense expenditures grew throughout the decade, this may reflect a larger relative importance of defense spending in recessionary (1977-1982) as opposed to expansionary (1982-1987) periods, or a changing composition of defense spending between the two intervals (towards, say, items such as ships, missiles, etc., produced by highly-specialized plants).
Again, because plant shipments going directly to defense agencies are reported only in 1988, inferences about the role of defense spending on plant growth during the 1977-1987 period are uncertain. That is, it is unclear whether 1988-reported plant direct defense shipments reflect plant activity in this area throughout the period, or whether growing plants tend eventually to become direct defense suppliers (by reaching a large-enough size).
Table 3 provides shares, both in the sample overall as well as in each type of heroic group, of plants distributed across several of the control variables in the growth regressions: plant age, industry, share of plant shipments going directly to defense agencies, and establishment ownership by a multi-plant firm (plant size is considered in the next section). This table is reported because, even after the average impact of these variables on growth rates has been factored out of inter-plant comparisons, there could still remain some residual contribution by them that distinguished Heroic Plants from their competitors.
For example, despite the controls for establishment age in employment-growth regressions, Heroic Plants are more likely to be new establishments (i.e., start-ups between 1973 and 1977) than are sampled plants overall. Similarly, Haltiwanger (1997) finds that younger (i.e., less than 10 years old) establishments in almost all size classes, while experiencing larger rates of both job creation and destruction, display positive net rates of employment growth. Net rates of job creation are generally negative for older plants.
This study’s finding that Heroic Plants are more likely to be younger establishments is intriguing, because a contrary result, in which persistently-rapid growers were disproportionately older plants, would not have been implausible. One could in this case imagine plant age to reflect, say, managerial experience. For example, Jovanovic hypothesizes that initial plant learning will have a positive impact on growth. Considering those plants whose residual growth, after controlling for this general age effect, suggested that they had enjoyed unusually-promising market conditions, one might expect older plants with a relatively experienced management to have been more successful in converting favorable opportunities into exceptionally-rapid, long-term expansion.
There are also industry differences between the sample and groups of Heroic Plants: Heroic Plants are disproportionately active in SIC 36-38. The implications of this are unclear. While these three 2-digit SICs do have higher mean rates of annual net job growth across 1973-1988 (see Davis, Haltiwanger and Schuh, 1996), a general industry effect should have been controlled for in growth regressions. Rates of simultaneous job creation and destruction, which would increase as industry employment shifted from declining to expanding plants, are also roughly the same across the 2-digit industries in the sample. The contribution of industry to persistent job growth will be explored further in subsequent research.
|
Results from Employment Growth Regressions, 1977-1982 and 1982-1987 |
|||
|
Estimated Growth Differential1 |
|||
|
1977-1982 |
1982-1987 |
||
|
Plant Size (Number of Employees) |
|||
|
1-99 |
.37*** |
.35*** |
|
|
100-249 |
.17*** |
.24*** |
|
250-499 |
.12*** |
.17*** |
|
500-999 |
.08*** |
.13*** |
|
1000-2499 |
-.01 |
.01 |
|
|
Date of Plant Birth |
|||
1973-1977 |
.28*** |
.12*** |
|
1968-1972 |
.10*** |
.09*** |
|
1964-1967 |
.07*** |
.04** |
|
|
Owned by a Multi-Plant Firm |
.04** |
.03** |
|
|
Share of Plant Shipments Sent Directly to Defense Agencies, 1988 |
|||
1-25 |
.07*** |
-.02 |
|
26-75 |
.11*** |
-.01 |
|
76-100 |
.18*** |
.14*** |
|
R2 |
.17 |
.09 |
|
|
1 Relative to the reference group of plants within each category, respectively: 2500+ employees; plant birth by 1963; not owned by a multi-plant firm; no shipments going directly to defense agencies. Also omitted from the table is the estimated intercept. Because establishment growth is expressed relative to mean size across each interval, coefficients cannot be interpreted as typical growth rate differentials. Reported significance levels incorporate a general correction for heteroscedasticity (see White (1980)). |
|||
|
* Statistically significant at the 10% level. |
|||
|
** Statistically significant at the 5% level. |
|||
|
*** Statistically significant at the 1% level. |
|||
|
Distribution of Heroic and Sample Plants Across Select Control Variables in Growth Equations, 1987: Date of Plant Birth; Standard Industrial Classification; Share of Plant Shipments Sent Directly to Defense Agencies; and Ownership by a Multi-Plant Firm |
||||
|
Sample |
Heroic Plants |
|||
|
Date of Plant Birth |
||||
|
1973-1977 |
16.2 |
23.9 |
||
|
1968-1972 |
18.0 |
19.4 |
||
|
1964-1967 |
12.0 |
10.3 |
||
|
-1963 |
53.7 |
46.5 |
||
|
2-Digit Industry Affiliation |
||||
|
Fabricated Metal Products (SIC 34) |
25.9 |
20.6 |
||
|
Industrial Machinery and Equipment (SIC 35) |
27.9 |
23.2 |
||
|
Electronic and Electric Equipment (SIC 36) |
19.6 |
21.9 |
||
|
Transportation Equipment (SIC 37) |
13.3 |
18.4 |
||
|
Instruments and Related Products (SIC 38) |
13.3 |
15.8 |
||
|
Share of Plant Shipments Sent Directly to Defense Agencies |
||||
|
0 |
58.8 |
56.5 |
||
|
1-25 |
33.5 |
34.8 |
||
|
26-75 |
4.6 |
4.8 |
||
|
76-100 |
3.1 |
3.9 |
||
|
Ownership by a Multi-Plant Firm |
64.4 |
59.0 |
||
Heroic Plant Employment Trends
Table 4 provides employment trends for the overall sample and for Heroic Plants.
Table 4 indicates that, between 1977 and 1987, Heroic Plants display exceptional rates of employment growth. These plants account for roughly 1 of every 4 jobs created by all plants that survive across this period; their share of job creation is between 3 and 5 times larger than the group’s beginning-period sample share. Shares of job losses by any group of Heroic Plants are non-existent in the quinquennial 1977-1987 data. Thus, this study’s Heroic Plants create jobs in each interval, be it during an upturn or downturn of the business cycle.
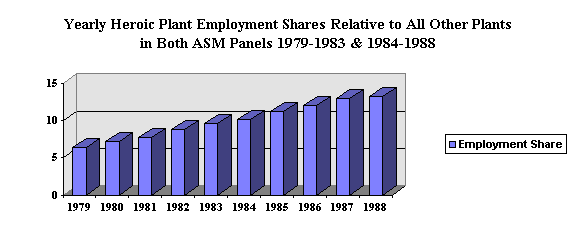
It is possible that exceptional establishment growth measured by quinquennial observations is not entirely representative of a plant’s performance within each 5-year period. The bar chart which follows Table 4 investigates the yearly performance of a subset of the Heroic Plants identified in the quinquennial COM data. Both this smaller group of heroic establishments, as well as the other plants represented by the bar chart, are found in the two ASM panels 1979-1983 and 1984-1988. The bar chart shows that job creation by this subset of Heroic Plants (implied by these plants’ increasing sample share of employment) persists from year to year.
The above-average rates of growth and disproportionate levels of job creation displayed by Heroic Plants are consistent with results from Davis, Haltiwanger and Schuh (1994) and Leonard (1987), who find job creation to be concentrated among rapidly-growing plants. The existence of a group of plants creating jobs at any phase in the business cycle, is also consistent with these studies’ findings. The present research shows that these facts also apply over a fairly long (ten-year) time horizon.
The median initial-period size of Heroic Plants lies far below the sample median. However, the subsequent exceptional job gains by Heroic Plants do not imply that smaller establishments’ overall employment performance is superior to that of larger plants. Indeed, using a more comprehensive sample of plants (i.e., of survivors and non-survivors), both Davis, Haltiwanger and Schuh (1996) and Dunne, Roberts and Samuelson (1989a, 1989b) show that, while some small plants do grow faster than larger ones, these job gains are offset by job losses at other small establishments which fail.
Although there is a disproportionate number of Heroic Plants in the smallest size class in 1977, the employment distribution of Heroic Plants is otherwise very similar to that for the sample overall. For instance, Table 5 shows that when plants are grouped according to whether their employment qualifies them in 1977 as a Small or Medium-Sized Enterprise (i.e., whether they have fewer than 500 employees), roughly 85% of Heroic Plants fall into the SME category. From Table 1 above, one finds that a similar number (about 80%) of plants in the sample overall qualify as SMEs at this time. By 1987, however, the share of Heroic Plants with at least 500 employees more than doubles, while the portion of large plants in the total sample rises only slightly (from Table 1, employment shares in 1977 and 1987 for all plants with at least 500 employees are 20.2 and 21.3 percent, respectively). Thus, what the heroic plant employment data illustrate is a process whereby SMEs disproportionately become large plants, and select large plants do exceptionally well in increasing their importance among large plants.
|
Table 4 Employment Trends for the Sample and for Heroic Plants, 1977-1992 |
||||||
|
|
Sample |
Heroic Plants |
||||
|
Number (Share) of Plants in 1977 |
4776 (100%) |
310 (6.5%) |
||||
|
Median Plant Employment |
||||||
|
1977 |
129 |
77 |
||||
|
1982 |
139 |
169 |
||||
|
1987 |
155 |
307 |
||||
|
1992 |
144 |
261 |
||||
|
Median Employment Change (%) |
||||||
|
1977-1982 |
5 |
84 |
||||
|
1982-1987 |
7 |
66 |
||||
|
1987-1992 |
-8 |
-8 |
||||
|
Plant Employment Share (%) |
||||||
|
1977 |
100 |
5 |
||||
|
1982 |
100 |
9 |
||||
|
1987 |
100 |
13 |
||||
|
1992 |
100 |
12 |
||||
|
D 1977-1992 (%) |
0 |
160% |
||||
|
Job Creation (Destruction) Share (%) |
||||||
|
1977-1982 |
100 (100) |
23.3 (00.2) |
||||
|
1982-1987 |
100 (100) |
27.1 (00.3) |
||||
|
1987-1992 |
100 (100) |
11.8 (14.5) |
||||
|
Job Creation (Destruction) Share/ |
||||||
|
1977-1982 |
1 (1) |
4.7 (0.04) |
||||
|
1982-1987 |
1 (1) |
3.0 (0.03) |
||||
|
1987-1992 |
1 (1) |
0.8 (1.12) |
||||
In contrast to their growth across 1977-1987, heroic plant performance drops off in the ‘out-of-sample’ period 1987-1992. The median growth rate of Heroic Plants just equals the sample median. Also, while some Heroic Plants do continue to grow during this period, others register sizable employment declines. Heroic Plant job destruction across 1987-1992 actually exceeds these plants’ employment share in 1987. This may be evidence of ‘regression-to-the-mean’ in the employment of some Heroic Plants.
The employment trends reported in Table 4 also show that persistently-rapid two-period growth is not a predictor of exceptional plant performance in the following period. Indeed, the number of Heroic Plants identified through residual growth in each 5-year period (310) is not much higher than the number one would expect from a series of independent, random shocks, as allowed for in the Jovanovic and Ericson and Pakes models discussed earlier.
Nonetheless, Heroic Plants roughly maintain, through 1992, the employment share that they had attained by 1987. The following numbers help illustrate how much these establishments increased their importance among survivor plants. Whereas 1 out of every 20 workers in the group of plants that survive across the 1977-1992 period was employed by a heroic job creator in 1977, these plants employed roughly 1 of every 8 such workers in both 1987 and 1992.
The magnitude of these employment shifts hardly lends itself to a thesis that heroic plant performance is entirely due to chance. Instead, rather than being simply the result of fortune smiling on a small group of plants (whose numbers successively dwindle with each roll of the dice), the results in Table 4 may be evidence of a select group of high-quality plants exploiting economic opportunities available to a much larger number of establishments. In other words, by simply inspecting the number of Heroic Plants identified, it is not possible to distinguish between a model of random shocks impinging on homogenous plants (after age and size have been controlled for), and a model where a distribution of other plant-specific attributes interacts with industry-wide opportunities (see, for example, hazard or duration models). To get at this requires investigating the establishment characteristics associated with rapidly-persistent growth. It is to this task that the current report now turns.
|
Distribution of Heroic Plants Across the Small Business Administration’s |
||||||
|
Heroic Plants |
||||||
|
Number of Employees |
Share of Plants in Size Class Each Year |
|||||
|
1977 |
1982 |
1987 |
1992 |
D 77-92 |
||
|
1-499 |
84.8 |
74.5 |
64.5 |
67.7 |
-20 |
|
|
500+ |
15.2 |
25.5 |
35.5 |
32.3 |
113 |
|
i. Heroic Plant Manufacturing Process, Product Markets Served, and Product Price
The SMT 1988 provides additional information on surveyed plants beyond their application of advanced technologies. Regular Census questionnaires do not ask for this information, which includes the type of manufacturing process used at the plant, the market for plant production, and the average price of plant products. Because heroic plant research relies primarily on longitudinal Census data to characterize persistently-rapid employment growers, it is instructive to consider first whether Heroic Plants are disproportionately concentrated with respect to one or more of the characteristics not found in the Census of Manufactures. This would give an idea of how many of the relevant characteristics, for selecting and describing Heroic Plants, the longitudinal Census data might miss. In other words, it is useful to know if Heroic Plants are found applying all types of manufacturing processes and serving all types of markets at different prices.
Table 6 compares the distribution of both heroic and all sampled plants across the three categories listed above. Heroic Plants are more likely than other establishments in the sample to be assembly operations, to produce for commercial product markets, and to offer products at an average price over $10,000. It is also interesting to note where Heroic Plants tend not to be found. This leaps out from Table 6: Heroic Plants are considerably less likely than other establishments to produce for industrial markets. These observations may be indicative of the declining importance of traditional manufacturing processes and product markets, and a trend towards more newer commercial or service-oriented activity. Recall from the preceding section that Heroic Plants tended also to be relatively young plants.
Similarly to many of the results for the distribution of Heroic Plants across control variables in growth regressions, however, the differences found for Heroic Plants in their concentration among manufacturing processes, product markets and output prices are not overwhelming. Indeed, a notable feature of this table is that Heroic Plants identify themselves across the entire spectrum of activity within each category. Thus, results from longitudinal Census data should, with respect to these three types of activities at least, provide a fairly robust selection and characterization of Heroic Plants.
|
Distribution of Sample and Heroic Plants Across Various Establishment Characteristics: Type of Manufacturing Process, Market for Plant |
||||
|
Sample |
Heroic Plants |
|||
|
Type of Plant Manufacturing Process |
||||
|
Assembly |
13.3 |
19.0 |
||
|
Fabrication/Machining |
13.3 |
12.3 |
||
|
Fabrication/Machining/Assembly |
68.4 |
64.8 |
||
|
Neither Fabrication/Machining/Assembly |
5.0 |
3.9 |
||
|
Market For Plant Products |
||||
|
Government |
9.5 |
11.6 |
||
|
Transportation |
11.5 |
12.9 |
||
|
Consumer (personal use by household) |
16.0 |
16.8 |
||
|
Commercial (offices, hospitals, services, etc.) |
14.3 |
19.4 |
||
|
Industrial (mfg., mining, construct. & utilities) |
41.7 |
32.9 |
||
|
Other / Unknown |
7.0 |
6.5 |
||
|
Average Price of Plant Products |
||||
|
< $5 |
15.2 |
15.2 |
||
|
$5 to $100 |
25.9 |
21.9 |
||
|
$101 to $1000 |
20.9 |
23.2 |
||
|
$1001 to $2000 |
5.8 |
5.8 |
||
|
$2001 to $10,000 |
11.9 |
10.3 |
||
|
Over $10,000 |
20.4 |
23.5 |
||
ii. Heroic Plant Characteristics from the LRD
This section considers how heroic plant characteristics such as labor productivity, worker wages, etc., differ from those of other plants in the sample. To make this analysis most instructive, results are reported for plants distinguished by the persistence and/or magnitude of their unexplained employment growth across 1977-1987. That is, desirable are estimates of how Heroic Plants are different, not just from all other plants, but from plants that also grow during this time but in a less impressive fashion. Such an approach allows for a sharper characterization of ‘heroism’ in job creation. It may also provide insights into how other groups of growing plants, for instance, short- and longer-term growers who post less rapid employment increases than do Heroic Plants, differ from one another as well as from the persistently-rapid growers who are the focus of this study.
Longitudinal Census of Manufactures data allow comparisons of numerous plant characteristics to be made at different points in time. This study compares the characteristics of plants, classified by residual growth status, at the beginning (1977) and end (1987) of the period across which this residual plant growth is ranked. Thus, this study explores whether there are observable characteristics that suggest how heroic plant behavior in 1977 might have laid the foundations for the persistently-rapid growth these plants will subsequently display. Alternatively, it examines how Heroic Plants distinguish themselves from other types of plants in 1987, and whether these differences point to heroic plant behavior across 1977-1987 which might have contributed to their growth. Ideally, such snap-shot pictures from such point-in-time regressions would provide insights into what is likely a very dynamic and fluid process of plant growth.
A standard linear regression model, in which the logarithm of each plant characteristic enters as dependent variable, is used to investigate differences in plant characteristics. All regressions control for the same set of variables that were used in the plant growth regressions earlier. For example, the 1977 characteristics of plants identified by their growth status across 1977-1987 are examined, holding constant plant age, size, etc., in 1977. Again, a primary task for heroic plant research is to explore those attributes which contribute to rates of plant growth beyond those conditioned by age, size, etc. Characteristic regressions in 1987 control for plants’ age, size, etc., in 1987. Recall that, in the Jovanovic model, size is an indicator of plant efficiency. Thus, this study compares heroic plant characteristics with those of establishments who (in the context of this model) have reached the same level of efficiency in 1987, but without having displayed heroic performance across 1977-1987.
Table 7 displays how this study categorizes different types of plant growth during the 1977-1987 period. Note that this classification scheme is structured around the year in which comparisons of plant characteristics are made. In particular, identification of exceptional plant growth begins in the period adjacent to the time-point of plant comparisons. For characteristic regressions in 1977, this allows the present study’s findings to be compared with those from previous research, which usually focuses on the relationship between current plant features and subsequent growth. For 1987 characteristic regressions, the order of the classification scheme is reversed.
In the characteristic regressions, an indicator variable is specified for each type of residual growth. If a plant can be placed into a growth category, the corresponding indicator variable takes a value of one. Otherwise, this variable takes a value of zero. Thus, the estimated coefficient for an indicator variable represents the mean value of a given characteristic for that group of plants, relative to the group of plants which do not fall into that category. And because plant characteristics are expressed in logarithms, estimated coefficients represent approximate mean percentage differences relative to other plants.
|
Classifying the Duration and Rapidity of Plant Growth, 1977-1987 |
|||
|
Type of Growth |
Criteria for Growth Classification, By Date of Characteristic Regression |
||
|
1977 |
1987 |
||
|
a) One-Period Exceptional Growth |
a) Ranked in Top 50% of Residual Growth, 77-82 |
a) Ranked in Top 50% of Residual Growth, 82-87 |
|
|
b) Two-Period Exceptional Growth |
b) Ranked in Top 50% of Residual Growth, 77-82 & 82-87 |
b) Ranked in Top 50% of Residual Growth, 82-87 & 77-82 |
|
c) Two-Period Exceptional Growth, Highly Rapid Growth One Period |
c) Ranked in Top 25% of Residual Growth, 77-82; Top 50%, 82-87 |
c) Ranked in Top 25% of Residual Growth, 82-87; Top 50%, 77-82 |
|
d) Highly Rapid Exceptional Growth in Both Periods (Heroic) |
d) Ranked in Top 25% of Residual Growth, 77-82 & 82-87 (Heroic) |
d) Ranked in Top 25% of Residual Growth, 82-87 & 77-82 (Heroic) |
|
Note that it is possible for a plant to be placed in more than one growth category. For instance, Heroic Plants receive a value of one for each of the four indicator variables generated by the growth classification in Table 7. This is because, if a plant ranks in the top quarter of the residual growth distribution in each period, it necessarily lies in the top half of the same distributions. Thus, to obtain an estimate of the average percentage difference in a characteristic’s value for Heroic Plants relative to the reference group of plants in the regression (i.e., from Table 7, those plants which are not placed in category ‘a’), one adds together all four coefficients. If the characteristic in question does not distinguish heroic plant performance from other types of less persistent and/or rapid growth, then the estimated coefficient for heroic growth should not, with statistical significance, be different from zero. In this case, however, Heroic Plants would still share with other less persistently and/or rapidly growing plants, characteristics which distinguished these growers from plants that did not display exceptional growth in the reference period.
The growth categories in Table 7 allow distinctions to be made on the basis of both the magnitude and persistence of plant growth. For instance, the coefficients reported for the types of growth in rows ‘a’ and ‘c’ represent a characteristic’s association with rapid growth, measured at two different levels. For category ‘a’, this is the top half of the residual growth distribution relative to the bottom half. For category ‘c’ it is the top quarter of residual growth relative to the top half, in each case for plants that grow in both periods. The coefficients for growth categories ‘b’ and ‘d’ correspondingly represent a characteristic’s association with persistent growth.
Table 8 reports the results from select plant characteristic regressions for 1977. While Heroic Plants do not distinguish themselves from other plants on the basis of these 1977 characteristics, they share, with other growing establishments across 1977-1987, features that are generally associated with superior plant performance. For example, together with other growing plants, Heroic Plants display in 1977 higher ratios of non-production to production workers, and greater capital intensity (i.e., larger capital to labor ratios) and average labor productivity. Almost all estimated coefficients for these variables in categories ‘a’ and ‘c’ are statistically-significant at the 5% level or lower, indicating that these characteristics are positively associated with the rapidity of plant growth across 1977-1982.
Capital-intensive production with a skilled workforce, implies that workers will be more productive and thus better paid. However, although the coefficient estimates in Table 8 offer a plausible characterization of plants poised for expansion, they may also be subject to some qualification. This is because some of the establishment attributes are expressed relative to establishment employment in 1977. Recalling the earlier discussion of regression-to-the-mean, transient changes to plant size can, in addition to generating inaccurate measures of plant growth trends, also bias results for the distinguishing characteristics of growing plants. For instance, if a plant attribute is expressed relative to initial size, and subsequent establishment growth represents merely a correction to a temporarily low plant size in this period, then some growing plants will, simply due to transient employment changes, display larger initial values of the attribute relative to non-growing plants. The same argument applies to plants whose employment declines represent a temporary drop-off in their size. As will be seen from 1987 characteristic regressions, the same bias might also be present when plant attributes are expressed relative to establishment size at the end of the growth period.
There is some suggestion of this in the data. Note that the ratio of non-production to production workers, plant capital intensity and average labor productivity, are positively associated only with the magnitude of plant growth across 1977-1982 (i.e., rows ‘a’ and ‘c’). Plants distinguished by the persistence of their growth across the entire 1977-1987 interval (rows ‘b’ and ‘d’) do not, relative to other plants, display above-average levels of these attributes in 1977. Indeed, there is generally a negative association between these three characteristics and plant growth persistence, which for non-production to production worker ratios is statistically significant at the 10% level.
Transient plant employment changes could play a role in coefficient patterns across growth categories, if the other components of the plant attributes in question were less variable than labor. For non-production to production worker ratios and capital intensity (the other variables being skilled workers and capital stocks, respectively), one can imagine this to be the case.
However, this is less clear for average labor productivity. Explanations for the pro-cyclical nature of plant productivity (when aggregate output falls, aggregate productivity tends to fall as well, and vice versa) emphasize that employment is less variable than value added. Admittedly, this study focuses on plants whose employment is by definition highly variable (upwards). But because plants in row ‘a’ account for half the sample, they should not be completely immune to the relative rigidity of labor adjustments observed for plants overall.
Hence, while transient plant employment changes may be influencing reported characteristics of growing plants, they are unlikely to be the sole cause of these establishments’ distinguishing characteristics. Indeed, an influence of transient employment changes is only one possible explanation for the results in Table 8. Another explanation is that the reported characteristics do not distinguish Heroic Plants in particular, and short- from long-term growth in general.
|
Plant Characteristic |
|||||||||||
|
Non-Prod. / Prod. Worker Ratio |
Production Worker Wages |
Capital to Labor Ratio |
Average Labor Productivity |
Net Return to Capital |
|||||||
|
Exceptional Grower Ranking |
|||||||||||
|
a) Ranked in Top 50% of Residual Growth, 77-82 |
0.16*** |
0.03*** |
0.14*** |
0.07*** |
0.03 |
||||||
|
b) Ranked in Top 50% of Residual Growth, 77-82 & 82-87 |
- 0.06* |
- 0.01 |
- 0.03 |
0.04 |
0.03 |
||||||
|
c) Ranked in Top 25% of Residual Growth, 77-82; Top 50%, 82-87 |
0.15** |
0.01 |
0.16*** |
0.07* |
- 0.09 |
||||||
|
d) Ranked in Top 25% of Residual Growth, 77-82 & 82-87 (Heroic) |
- 0.11* |
- 0.01 |
- 0.05 |
- 0.05 |
0.02 |
||||||
|
Heroic Plant Total (a + b + c + d) |
0.31 |
0.03 |
0.30 |
0.07 |
0.00 |
||||||
|
*, ** and *** denote statistical significance at the 10, 5 and 1% level, respectively. |
|||||||||||
In contrast, Table 9 shows that Heroic Plants do distinguish themselves by their 1977 rates of gross investment, measured as changes in the book value of capital stocks. This is true when gross investment is expressed relative not just to plant employment, but to two additional size measures that should make results less sensitive to transient employment changes: plant value added and capital stock at the beginning of the year. Relative to all three size measures, the gross investment specific to Heroic Plants in 1977 is in almost all cases larger than that found for any other category of employment growth over the period.
Only larger, ASM establishments provide data on types of investment (i.e., buildings and structures versus equipment). While the number of observations is consequently limited, and inferences based on them less reliable, regression results (not reported) from the subset of heroic and other sample plants surveyed by the ASM in 1977 show that Heroic Plants distinguish themselves by their higher rates of investment in equipment, rather than buildings and structures (which is the type of fixed, up-front investment one might expect most from subsequently growing plants).
Gross investment rates are not consistently associated with the magnitude of employment growth. While the coefficients for row ‘a’ are uniformly positive and statistically significant from zero, those in row ‘c’ are sizable but statistically significant for only the gross investment per employee measure. Also, plants that grow persistently but less rapidly (row ‘b’) do not display higher gross investment rates in 1977 than do plants that grow at roughly the same rate for 1977-1982 alone (row ‘a’). Thus, there appears to be an up-front investment associated with persistently-rapid employment growth by surviving plants, which is not found for persistent growth of a lower magnitude.
|
Gross Investment Measure 1 |
|||||
|
Investment / Worker |
Investment / Value Added |
Investment / Capital Stock |
|||
|
Exceptional Grower Ranking |
|||||
a) Ranked in Top 50% of Residual Growth, 77-82 |
0.22*** |
0.14*** |
0.09*** |
||
b) Ranked in Top 50% of Residual Growth, 77-82 & 82-87 |
0.02 |
- 0.03 |
0.03 |
||
c) Ranked in Top 25% of Residual Growth, 77-82; Top 50%, 82-87 |
0.16** |
0.12 |
0.07 |
||
d) Ranked in Top 25% of Residual Growth, 77-82 & 82-87 (Heroic) |
0.20** |
0.23** |
0.26*** |
||
Heroic Plant Total (a + b + c + d) |
0.58 |
0.37 |
0.35 |
||
|
1 Measured as changes in the book value of capital stocks.*, ** and *** denote statistical significance at the 10, 5 and 1% level, respectively. |
|||||
Because Heroic Plants appear to be investing early in future growth, explaining their performance through a series of random shocks is less plausible than one might have assumed on the basis of earlier results for expected and actual numbers of Heroic Plants identified across two periods. However, it is unclear why higher early investment should not also be associated with persistent but less rapid growers (row ‘b’). In any event, the higher rate of 1977 gross investment for this sample’s group of growing plants overall (recall that the positive coefficients in row ‘a’ of Table 9 apply to rows b-d as well) makes the absence of a statistically-significant, positive association between returns to capital in 1977 and subsequent employment growth, seen earlier in Table 8, more respectable.
By identifying large amounts of investment by growing plants, and establishing a link between this investment and subsequent establishment behavior, this study’s results are quite consistent with previous findings. While too much should not be inferred from results based on one year of plant investment data (especially given the possibility of measurement error in capital-stock variables), these results do support Doms, Dunne and Robert’s (1995) call for "models of industry evolution that recognize the inter-temporal effects of plant investment decisions...(and thus)...the role of capital as a determinant of an industry’s pattern of evolution."
Table 10 reports results from characteristic regressions in 1987. By assessing heroic plant attributes relative to plants of the same efficiency at this time but also of less impressive growth across 1977-1987, this analysis offers another perspective on establishments that enjoy persistently-rapid growth.
Heroic Plants distinguish themselves in 1987 by their higher average labor productivity. This is true in spite of the fact that these plants have recently accommodated more rapid and sustained inflows of new workers than any other group of plants, and share the statistically-significant, negative capital intensity coefficients of other growing plants. Higher productivity in 1987 is also found for plants that grow persistently but at lower rates (row ‘b’). However, this premium is reversed for plants that grow persistently, but very rapidly only in 1982-1987 (row ‘c’). Note that this latter group of plants’ capital to labor ratio also falls. Thus, this result may, for reasons discussed earlier, be diluted by a transient employment-growth component.
However, a negative association between labor productivity and the magnitude of employment growth (in addition to results in row ‘c,’ note also the negative but statistically insignificant labor productivity estimate for one-period growers in row ‘a’) may also suggest the presence of adjustment costs in translating exceptionally-rapid employment gains into corresponding output gains (recall the discussion above concerning the relative variability of labor). That is, as the magnitude of employment growth increases, adjustment costs rise and with them the obstacles to realizing proportionate output increases. In this context, plants whose growth had begun earlier (i.e., establishments in rows ‘b’ and ‘d’), might, through learning or some other attribute associated with long-term growth, be better positioned for this.
Baily, Bartelsman and Haltiwanger (1995) similarly find that "plants that increased employment as well as productivity contributed almost as much to overall productivity growth as did plants that increased productivity at the expense of employment." Similarly, this study’s results show that capital intensity is not a prerequisite for plant productivity. Rather, the way capital is used appears to be more important for plants that persistently create jobs. A similar conclusion about the importance of efficient use of capital emerges from an inter-country productivity comparison by the McKinsey Global Institute (1996).
Table 10 shows that, while all exceptionally-growing plants by 1987 pay lower production worker wages, Heroic Plants offer lower wages still. This is in contrast to results from Table 8, in which plants at the onset of their observed growth provide above-average remuneration to their production workers. An explanation for this may be that new hires, which by 1987 would constitute such a large share of the workforces of recently-expanded plants (and of Heroic Plants in particular), receive lower wages simply on the basis of seniority. Indeed, estimation results (reported in the Appendix) which compare the change in production worker wages across 1977-1987, indicate that growing plants’ lower average production worker wages is the result of a decline during the period, rather than a lower wage paid by these plants at the onset of their growth. For this reason, inferences about the level of worker skills (implied through inter-plant wage comparisons) within Heroic Plants, are difficult. In spite of paying lower wages, however, through their exceptional growth across 1977-1987 Heroic Plants do offer greater employment opportunities during this period than do other plants.
In light of Heroic Plants’ superior labor productivity, lower production worker wages within these plants raise questions about the division of returns, between management and workers, from superior business performance. Similarly, Baily, Bartelsman and Haltiwanger (1995) find that, while plants that increase employment along with productivity also raise the wages they pay, this increase is not commensurate with the increase in plant productivity.
Heroic Plants also share with other growing plants a lower non-production to production worker ratio. The negative and statistically significant coefficients in rows ‘a’ and ‘c’ indicate that this characteristic is negatively associated with the magnitude of plant employment growth across 1982-1987. Note that the non-production to production worker ratio is approximately 23 percentage points lower for plants of exceptional growth across 1982-1987, but only 5 percentage points lower for plants of comparable growth in both periods. As with some earlier results, transient employment changes may be playing a role here.
|
Plant Characteristic |
|||||||||
|
Non-Prod. / Prod. Worker Ratio |
Production Worker Wages |
Capital to Labor Ratio |
Average Labor Productivity |
Net Return to Capital |
|||||
|
Exceptional Grower Ranking |
|||||||||
|
a) Ranked in Top 50% of Residual Growth, 82-87 |
- 0.23*** |
- 0.06*** |
- 0.17*** |
- 0.02 |
0.13*** |
||||
|
b) Ranked in Top 50% of Residual Growth, 82-87 & 77-82 |
0.18*** |
0.01 |
0.06* |
0.07*** |
0.02 |
||||
|
c) Ranked in Top 25% of Residual Growth, 82-87; Top 50%, 77-82 |
- 0.10* |
- 0.02 |
- 0.11** |
- 0.11*** |
0.00 |
||||
|
d) Ranked in Top 25% of Residual Growth, 82-87 & 77-82 (Heroic) |
0.01 |
- 0.07*** |
0.02 |
0.10** |
0.07 |
||||
|
Heroic Plant Total (a + b + c + d) |
- 0.05 |
- 0.13 |
- 0.28 |
0.06 |
0.13 |
||||
|
*, ** and *** denote statistical significance at the 10%, 5% and 1% level, respectively. |
|||||||||
Heroic Plant Advanced Technology Use
To determine whether Heroic Plants differ from less persistent and/or rapid growers in their use of advanced technologies, this study estimates several Poisson regressions on the total number of technologies used by a plant in 1988. Each estimation includes the same variables found in 1987 characteristics regressions. Results obtained after controlling for this basic set of variables are then compared to estimates from regressions that include additional establishment characteristics potentially influencing advanced technology use, such as plant manufacturing process, product market and price, and capital intensity.
Table 10 reports results from the Poisson regressions. As expected, the number of technologies used at a plant is positively associated with establishment size. Also similar to Dunne’s (1994) results on plant use of select individual technologies, plant age does not consistently influence advanced technology use, while ownership by a multi-plant firm and plant status as a direct supplier to defense agencies in general display positive correlations.
Table 10 also shows that, relative to establishments that display exceptional growth only briefly or not at all during this time, both Heroic Plants as well as other plants that grow across the entire 1977-1987 interval use a slightly higher number of advanced technologies in 1988. Interestingly, when capital intensity is not controlled for, plants that display exceptional growth across the previous five years (1982-1987) register below-average rates of advanced technology use. This negative coefficient in row ‘a’ is outweighed in these cases by the above-average advanced technology use displayed by persistent growers (row ‘b’). Controlling for capital intensity eliminates the negative coefficient of one-period growers, while leaving unchanged the coefficient on technology usage by persistent growers.
Some of the surprising, negative result for exceptional growers across only 1982-1987 may be due to the nature of the control (or reference) group. The coefficient in row ‘a’ expresses 1988 levels of plant technology use by plants who grow exceptionally across 1982-1987 alone, relative to all plants that are not found in the top half of this distribution. Thus, plants that display exceptional growth (either positive or negative) of any magnitude across 1977-1982 but not 1982-1987, are in the reference group. If rapid, but unsustained, growth in 1977-1982 led to relatively early technology use, and such plants were dominant in the omitted group, then the coefficient for later growers might be negative. This presumes of course that the early advantage was not negated by subsequent below-average growth in 1982-1987.
However, because the initial date of technology use cannot be determined with these data, it impossible to say when Heroic Plants and other persistent growers began to apply advanced technologies. One might expect that, holding all else constant, the earlier an establishment began use of any technology the larger the number of technologies it would use at any later date. For instance, in his Bayesian model of intra-firm diffusion, Stoneman (1981) emphasizes the uncertainty surrounding a new technology. Because of this uncertainty, firms incrementally increase their stock of the (assumed profitable) innovation as they learn more about it. Apart from learning considerations and considering specific technologies, Ewers, Becker and Fritsch (1990) find that plants often begin by adopting one technology (Computer Numerically-Controlled Machine Tools, or CNC) and only thereafter, once enough production has been automated, implement complementary technologies such as Computer Automated Design (CAD).
If this were the case, then the results for a positive association between persistent plant growth across 1977-1987 and numbers of technologies used in 1988, are striking. In such a scenario, persistently-growing plants would have overcome an initial size disadvantage for advanced technology use in the mid-1970s (when many of these technologies first became widely available), and would as well have accommodated a steady and rapid inflow of workers across the decade, to attain an eventual level of advanced technology use in 1988 somewhat greater than other comparably-sized plants. Such a performance would become even more impressive as one increased the magnitude of persistent growth (i.e., as one moved from row ‘b’ to row ‘d’). That is, while Heroic Plants by definition were in 1977 considerably smaller than other persistent (but less rapid) growers, they nonetheless share with these latter plants above-average levels of technology use.
Whether this study’s findings reflect a fundamental contribution of advanced technologies to these plants’ growth, or simply the ability of such successful plants to manage innovation, cannot be determined from these data. As emphasized earlier, advanced technology use may be proxying for other unobserved attributes contributing to plant growth, such as management and workforce quality, etc. In any event, the results do speak to the potential usefulness of advanced technologies to superior plant performance: otherwise, such successful plants would not be more likely than other plants to use them.
Indeed, ten years into a period of rapid technological change, advanced technology use helps to distinguish plants whose employment grew exceptionally throughout the period, from establishments of either more brief or non-existent exceptional growth during this time. In this vein, Baldwin et. al. (1994) find that growing Small- and Medium-Sized Enterprises cite innovative ability as the most important contributor to their success.
|
Employment Growth Status and Advanced Technology Use in 1988 |
|||||||||||
|
(1) Growth Regression Controls in 19871 |
(2) Controls in (1) Plus Other Plant Characteristics2 |
(3) Controls in (2) Plus Capital Intensity3 |
|||||||||
|
Intercept |
2.24*** (0.11) |
1.81*** (0.12) |
0.73*** (0.11) |
||||||||
|
Plant Size (Number of Employees) |
|||||||||||
|
1-99 |
-1.69*** (0.11) |
-1.68*** (0.10) |
-1.43*** (0.08) |
||||||||
|
100-249 |
-1.11*** (0.10) |
-1.11*** (0.10) |
-0.88*** (0.08) |
||||||||
250-499 |
-0.83*** (0.10) |
-0.82*** (0.10) |
-0.62*** (0.08) |
||||||||
500-999 |
-0.54*** (0.11) |
-0.53*** (0.10) |
-0.37*** (0.08) |
||||||||
1000-2499 |
-0.28** (0.12) |
-0.26** (0.11) |
-0.16* (0.09) |
||||||||
|
Date of Plant Birth |
|||||||||||
1973-1977 |
0.05 (0.03) |
0.07** (0.03) |
0.06** (0.03) |
||||||||
1968-1972 |
0.03 (0.03) |
0.04 (0.03) |
0.04 (0.03) |
||||||||
1964-1967 |
0.06* (0.03) |
0.06* (0.03) |
0.06** (0.03) |
||||||||
|
Plant Capital Intensity |
N/A |
N/A |
0.26*** (0.01) |
||||||||
|
Owned by a Multi-Plant Firm |
0.19*** (0.03) |
0.19*** (0.03) |
0.12*** (0.03) |
||||||||
|
Share of Plant Shipments Sent Directly to Defense Agencies, 1988 |
|||||||||||
1-25 |
0.10*** (0.02) |
0.06*** (0.02) |
0.08*** (0.02) |
||||||||
26-75 |
0.20*** (0.05) |
0.07 (0.06) |
0.11** (0.05) |
||||||||
76-100 |
0.05 (0.07) |
-0.08 (0.08) |
0.05 (0.07) |
||||||||
Plant Employment Growth Status |
|||||||||||
a) Ranked in Top 50% of Residual Growth, 82-87 |
-0.05** (0.03) |
-0.05** (0.03) |
-0.01 (0.02) |
||||||||
b) Ranked in Top 50% of Residual Growth, 82-87 & 77-82 |
0.08** (0.04) |
0.08** (0.04) |
0.07** (0.03) |
||||||||
c) Ranked in Top 25% of Residual Growth, 82-87; Top 50%, 77-82 |
0.00 (0.05) |
0.00 (0.05) |
0.03 (0.05) |
||||||||
d) Ranked in Top 25% of Residual Growth, 82-87 & 77-82 (Heroic) |
-0.02 (0.06) |
-0.02 (0.06) |
-0.03 (0.05) |
||||||||
Heroic Plant Total (a + b + c + d) |
0.03 |
0.03 |
0.07 |
||||||||
|
1 Results from Poisson regressions of number of advanced technologies used. Excluded are coefficients for establishment 2-digit industry and region, and for an over-dispersion parameter relaxing the usual Poisson assumption that the variance of the dependent variable equals its mean. |
|||||||||||
|
2 Additional plant characteristics are type of manufacturing process, product market and average product price. |
|||||||||||
|
3 Capital intensity is expressed as the ratio of the book value of plant machinery assets to total employment. |
|||||||||||
|
*, **, *** denote statistical significance at the 10%, 5% and 1% level, respectively; standard errors are in parentheses. Rounding may produce a seeming discrepancy between reported significance levels and apparent t-values. |
|||||||||||
Heroic Plant research shows that persistently-rapid job creation by a select group of plants can be an important source of overall employment growth in manufacturing. While these Heroic Plants tend especially to participate in growing sectors of the economy (favoring, for example, commercial over industrial markets), they are nonetheless active across a variety of product markets, production processes and price ranges. Thus, sustained job growth does emerge as simply a sectoral phenomenon within particular industries.
Neither does these plants’ exceptional job creation appear to be the result of random shocks to establishment growth. Rather, in spite of the difficulties in measuring performance characteristics using time-series data, Heroic Plants display numerous characteristics of successful plants.
For example, when their exceptional growth begins to be tracked in 1977, these plants are more capital intensive and productive, and they pay higher wages, than do plants whose growth will be less rapid and/or persistent during the next decade. They also distinguish themselves by larger gross investment ratios (relative either to their current employment, value added or capital stock).
In 1987, Heroic Plants display higher labor productivity than do other plants, in spite of their labor-intensive operations. These plants also share with other persistent (although less rapid) growers an above-average tendency to use advanced technologies in 1988. Finally, Heroic Plants pay lower wages to production workers than do other plants. In light of the labor productivity premium just cited, lower production worker wages within Heroic Plants raise questions about the division of returns to, and contributions of, owners, management and workers in successful businesses.
The existence and significance of such exceptional performers could have significant policy implications. For example, results from this study suggest that, beyond the amount of capital plants have, the way capital is used makes an important contribution to labor productivity. This finding echoes a conclusion from the McKinsey Institute’s recent international comparison of productivity levels. Hence, an alternative policy to relying on cuts in capital gains to stimulate growth might be to disseminate, to the extent possible, the ‘best-practice’ of successful establishments. However, because the present study’s findings are only suggestive, conclusions about those factors responsible for persistent establishment performance differences await the outcome of future research.
One immediate next step in this direction is to assess Heroic Plant performance relative to traditional targets for government policy. For example, how much of a role do industry affiliation and geographic location play in sustained plant growth? Indeed, are Heroic Plants found in all industries, or is this phenomenon limited to the technology-intensive sectors considered by this study? The answer to these questions would provide an indication of the potential return from reorienting policy away from industry-wide or regional programs towards more establishment-level ones.
Secondly, research must determine whether the plant or the firm is the appropriate object for policy. That is, are there ‘Heroic Firms,’ and if so, how do they compare, in terms of both their contribution to employment growth as well as their distinguishing characteristics, with the Heroic Plants discussed above?
Finally, what are the factors contributing to the exceptional performance identified by this study, and which policy could foster? One way of addressing this issue would be to initiate a survey for data on, say, product innovation, business strategy and management techniques, as collected now by Statistics Canada. However, much can also be done with data already available.
For example, it would be interesting to compare the present results with those from analyzing a cohort of plants and/or firms, i.e., a sample of businesses that began operation at the same time. This would allow business failure to be taken into account when considering performance.
Further, one might explore the sources of superior performance by asking whether multi-unit firms grew by expanding within industries or across them, and whether plants associated with these firms compared favorably to other plants in the relevant industries. Such results would indicate the degree to which exceptional business growth was due to particular production techniques (which would tend to be industry-specific), as opposed to organizational attributes (which could be more applicable across industries).
APPENDIX: COMPLETE PLANT CHARACTERISTICS REGRESSIONS
There are two sets of tables for estimated plant characteristic differentials, one set for regressions in 1977 (i.e., characteristic levels and control variables in 1977), and one set for 1987. Also reported in both sets of tables are estimated differentials for percentage characteristics changes from 1977 to 1987. For characteristic regressions in 1977, the corresponding difference, in 1987, for any group of growing plants relative to the 1977 control group, can be obtained by adding the coefficient for the percentage change across 1977-1987 to the 1977 estimated level. For 1987 characteristic regressions, the corresponding 1977 level is obtained by subtracting from that year’s estimated characteristic differential the coefficient estimated for the change across 1977-1987.
Note that rounding, to the second digit, of coefficient estimates and standard errors, may produce a seeming discrepancy between reported significance levels and apparent t-values.
|
1) Plant Workforce Characteristics in 1977 |
|||||||||||||||
|
A. Non-Production / Production Worker Ratio |
|||||||||||||||
|
1977 |
D , 77-87 |
||||||||||||||
|
Exceptional Grower Ranking |
|||||||||||||||
a) Ranked in Top 50% of Residual Growth, 77-82 |
0.16*** (0.03) |
- 0.03 (0.03) |
|||||||||||||
b) Ranked in Top 50% of Residual Growth, 77-82 & 82-87 |
- 0.06* (0.04) |
- 0.06 (0.04) |
|||||||||||||
c) Ranked in Top 25% of Residual Growth, 77-82; Top 50%, 82-87 |
0.15*** (0.05) |
- 0.02 (0.05) |
|||||||||||||
d) Ranked in Top 25% of Residual Growth, 77-82 & 82-87 (Heroic) |
- 0.11* (0.06) |
- 0.05 (0.06) |
|||||||||||||
Heroic Plant Total (a + b + c + d) |
0.31 |
0.00 |
|||||||||||||
|
B. Average Wage, Non-Production Workers |
|||||||||||||||
|
1977 |
D ,77-87 |
||||||||||||||
|
Exceptional Grower Ranking |
|||||||||||||||
a) Ranked in Top 50% of Residual Growth, 77-82 |
0.02 (0.01) |
0.00 (0.02) |
|||||||||||||
b) Ranked in Top 50% of Residual Growth, 77-82 & 82-87 |
0.03 (0.02) |
- 0.02 (0.02) |
|||||||||||||
c) Ranked in Top 25% of Residual Growth, 77-82; Top 50%, 82-87 |
- 0.02 (0.03) |
0.03 (0.03) |
|||||||||||||
d) Ranked in Top 25% of Residual Growth, 77-82 & 82-87 (Heroic) |
0.02 (0.03) |
- 0.04 (0.04) |
|||||||||||||
Heroic Plant Total (a + b + c + d) |
0.00 |
0.00 |
|||||||||||||
|
C. Average Wage, Production Workers |
|||||||||||||||
|
1977 |
D ,77-87 |
||||||||||||||
|
Exceptional Grower Ranking |
|||||||||||||||
a) Ranked in Top 50% of Residual Growth, 77-82 |
0.03*** (0.01) |
0.01 (0.01) |
|||||||||||||
b) Ranked in Top 50% of Residual Growth, 77-82 & 82-87 |
- 0.01 (0.01) |
0.00 (0.02) |
|||||||||||||
c) Ranked in Top 25% of Residual Growth, 77-82; Top 50%, 82-87 |
0.01 (0.02) |
- 0.02 (0.02) |
|||||||||||||
d) Ranked in Top 25% of Residual Growth, 77-82 & 82-87 (Heroic) |
- 0.01 (0.02) |
- 0.05 (0.03) |
|||||||||||||
Heroic Plant Total (a + b + c + d) |
0.03 |
0.00 |
|||||||||||||
|
2) Plant Capital to Labor Ratio, Labor Productivity and Net Return to Capital in 1977 |
|||||||||||||||
|
A. Capital / Labor Ratio |
|||||||||||||||
|
1977 |
D ,77-87 |
||||||||||||||
|
Exceptional Grower Ranking |
|||||||||||||||
a) Ranked in Top 50% of Residual Growth, 77-82 |
0.14*** (0.02) |
- 0.06** (0.03) |
|||||||||||||
b) Ranked in Top 50% of Residual Growth, 77-82 & 82-87 |
- 0.03 (0.03) |
- 0.06 (0.04) |
|||||||||||||
c) Ranked in Top 25% of Residual Growth, 77-82; Top 50%, 82-87 |
0.16*** (0.05) |
- 0.10* (0.06) |
|||||||||||||
d) Ranked in Top 25% of Residual Growth, 77-82 & 82-87 (Heroic) |
- 0.05 (0.05) |
- 0.02 (0.07) |
|||||||||||||
Heroic Plant Total (a + b + c + d) |
0.30 |
- 0.06 |
|||||||||||||
|
B. Average Labor Productivity (Value Added Per Employee) |
|||||||||||||||
|
1977 |
D ,77-87 |
||||||||||||||
|
Exceptional Grower Ranking |
|||||||||||||||
a) Ranked in Top 50% of Residual Growth, 77-82 |
0.07*** (0.02) |
- 0.02 (0.02) |
|||||||||||||
b) Ranked in Top 50% of Residual Growth, 77-82 & 82-87 |
0.04 (0.03) |
- 0.03 (0.03) |
|||||||||||||
c) Ranked in Top 25% of Residual Growth, 77-82; Top 50%, 82-87 |
0.07* (0.03) |
- 0.02 (0.04) |
|||||||||||||
d) Ranked in Top 25% of Residual Growth, 77-82 & 82-87 (Heroic) |
- 0.05 (0.04) |
0.06 (0.05) |
|||||||||||||
Heroic Plant Total (a + b + c + d) |
0.07 |
0.00 |
|||||||||||||
|
C. Net Return to Capital |
|||||||||||||||
|
1977 |
D ,77-87 |
||||||||||||||
|
Exceptional Grower Ranking |
|||||||||||||||
a) Ranked in Top 50% of Residual Growth, 77-82 |
0.03 (0.03) |
- 0.06 (0.04) |
|||||||||||||
b) Ranked in Top 50% of Residual Growth, 77-82 & 82-87 |
0.03 (0.05) |
0.04 (0.06) |
|||||||||||||
c) Ranked in Top 25% of Residual Growth, 77-82; Top 50%, 82-87 |
- 0.09 (0.06) |
0.12 (0.08) |
|||||||||||||
d) Ranked in Top 25% of Residual Growth, 77-82 & 82-87 (Heroic) |
0.02 (0.07) |
0.03 (0.10) |
|||||||||||||
Heroic Plant Total (a + b + c + d) |
0.00 |
0.00 |
|||||||||||||
|
3) Plant Investment in 1977 |
|||||||||||||||
|
A. Investment in Structures & Equipment Per Employee |
|||||||||||||||
|
1977 |
D ,77-87 |
||||||||||||||
|
Exceptional Grower Ranking |
|||||||||||||||
a) Ranked in Top 50% of Residual Growth, 77-82 |
0.22*** (0.04) |
- 0.14*** (0.06) |
|||||||||||||
b) Ranked in Top 50% of Residual Growth, 77-82 & 82-87 |
0.02 (0.06) |
0.17** (0.08) |
|||||||||||||
c) Ranked in Top 25% of Residual Growth, 77-82; Top 50%, 82-87 |
0.16** (0.08) |
- 0.21** (0.11) |
|||||||||||||
d) Ranked in Top 25% of Residual Growth, 77-82 & 82-87 (Heroic) |
0.20** (0.10) |
- 0.13 (0.12) |
|||||||||||||
Heroic Plant Total (a + b + c + d) |
0.58 |
- 0.18 |
|||||||||||||
|
B. Investment in Structures & Equipment / Value Added |
|||||||||||||||
|
1977 |
D ,77-87 |
||||||||||||||
|
Exceptional Grower Ranking |
|||||||||||||||
a) Ranked in Top 50% of Residual Growth, 77-82 |
0.14*** (0.04) |
- 0.11** (0.06) |
|||||||||||||
b) Ranked in Top 50% of Residual Growth, 77-82 & 82-87 |
- 0.03 (0.06) |
0.23*** (0.08) |
|||||||||||||
c) Ranked in Top 25% of Residual Growth, 77-82; Top 50%, 82-87 |
0.12 (0.08) |
- 0.20* (0.11) |
|||||||||||||
d) Ranked in Top 25% of Residual Growth, 77-82 & 82-87 (Heroic) |
0.23** (0.10) |
- 0.17 (0.13) |
|||||||||||||
Heroic Plant Total (a + b + c + d) |
0.37 |
0.12 |
|||||||||||||
|
B. Investment in Structures & Equipment / Capital Stock |
|||||||||||||||
|
1977 |
D ,77-87 |
||||||||||||||
|
Exceptional Grower Ranking |
|||||||||||||||
a) Ranked in Top 50% of Residual Growth, 77-82 |
0.09** (0.05) |
- 0.10 (0.06) |
|||||||||||||
b) Ranked in Top 50% of Residual Growth, 77-82 & 82-87 |
0.03 (0.06) |
0.31*** (0.09) |
|||||||||||||
c) Ranked in Top 25% of Residual Growth, 77-82; Top 50%, 82-87 |
0.07 (0.09) |
- 0.15 (0.12) |
|||||||||||||
d) Ranked in Top 25% of Residual Growth, 77-82 & 82-87 (Heroic) |
0.26*** (0.10) |
- 0.15 (0.14) |
|||||||||||||
Heroic Plant Total (a + b + c + d) |
0.35 |
0.31 |
|||||||||||||
|
1) Plant Workforce Characteristics in 1987 |
||||
|
A. Non-Production / Production Worker Ratio |
||||
|
1987 |
D ,77-87 |
|||
|
Exceptional Grower Ranking |
||||
a) Ranked in Top 50% of Residual Growth, 82-87 |
- 0.23*** (0.03) |
- 0.12*** (0.03) |
||
b) Ranked in Top 50% of Residual Growth, 82-87 & 77-82 |
0.18*** (0.04) |
0.03 (0.04) |
||
c) Ranked in Top 25% of Residual Growth, 82-87; Top 50%, 77-82 |
- 0.10* (0.06) |
- 0.06 (0.05) |
||
d) Ranked in Top 25% of Residual Growth, 82-87 & 77-82 (Heroic) |
0.01 (0.06) |
- 0.02 (0.06) |
||
Heroic Plant Total (a + b + c + d) |
- 0.05 |
- 0.12 |
||
|
B. Average Wage, Non-Production Workers |
||||
|
1987 |
D ,77-87 |
|||
|
Exceptional Grower Ranking |
||||
a) Ranked in Top 50% of Residual Growth, 82-87 |
- 0.02* (0.01) |
- 0.01 (0.02) |
||
b) Ranked in Top 50% of Residual Growth, 82-87 & 77-82 |
0.01 (0.02) |
- 0.02 (0.02) |
||
c) Ranked in Top 25% of Residual Growth, 82-87; Top 50%, 77-82 |
0.01 (0.03) |
0.02 (0.03) |
||
d) Ranked in Top 25% of Residual Growth, 82-87 & 77-82 (Heroic) |
- 0.02 (0.03) |
- 0.04 (0.04) |
||
Heroic Plant Total (a + b + c + d) |
0.00 |
0.00 |
||
|
C. Average Wage, Production Workers |
||||
|
1987 |
D ,77-87 |
|||
|
Exceptional Grower Ranking |
||||
a) Ranked in Top 50% of Residual Growth, 82-87 |
- 0.06*** (0.01) |
- 0.04*** (0.01) |
||
b) Ranked in Top 50% of Residual Growth, 82-87 & 77-82 |
0.01 (0.01) |
0.02 (0.02) |
||
c) Ranked in Top 25% of Residual Growth, 82-87; Top 50%, 77-82 |
- 0.02 (0.02) |
- 0.01 (0.02) |
||
d) Ranked in Top 25% of Residual Growth, 82-87 & 77-82 (Heroic) |
- 0.07*** (0.02) |
- 0.07*** (0.03) |
||
Heroic Plant Total (a + b + c + d) |
- 0.13 |
- 0.11 |
||
|
2 ) Plant Capital to Labor Ratio, Labor Productivity and Net Return to Capital in 1987 |
||||
|
A. Capital / Labor Ratio |
||||
|
1987 |
D ,77-87 |
|||
|
Exceptional Grower Ranking |
||||
a) Ranked in Top 50% of Residual Growth, 82-87 |
- 0.17*** (0.03) |
- 0.12*** (0.03) |
||
b) Ranked in Top 50% of Residual Growth, 82-87 & 77-82 |
0.06* (0.04) |
- 0.06 (0.04) |
||
c) Ranked in Top 25% of Residual Growth, 82-87; Top 50%, 77-82 |
- 0.11** (0.05) |
- 0.01 (0.06) |
||
d) Ranked in Top 25% of Residual Growth, 82-87 & 77-82 (Heroic) |
0.02 (0.06) |
- 0.11* (0.07) |
||
Heroic Plant Total (a + b + c + d) |
- 0.28 |
- 0.12 |
||
|
B. Average Labor Productivity (Value Added Per Employee) |
||||
|
1987 |
D ,77-87 |
|||
|
Exceptional Grower Ranking |
||||
a) Ranked in Top 50% of Residual Growth, 82-87 |
- 0.02 (0.02) |
- 0.01 (0.02) |
||
b) Ranked in Top 50% of Residual Growth, 82-87 & 77-82 |
0.07*** (0.03) |
- 0.02 (0.03) |
||
c) Ranked in Top 25% of Residual Growth, 82-87; Top 50%, 77-82 |
- 0.11*** (0.04) |
- 0.03 (0.04) |
||
d) Ranked in Top 25% of Residual Growth, 82-87 & 77-82 (Heroic) |
0.10** (0.05) |
0.06 (0.05) |
||
Heroic Plant Total (a + b + c + d) |
0.06 |
0.00 |
||
|
C. Net Return to Capital |
||||
|
1987 |
D ,77-87 |
|||
|
Exceptional Grower Ranking |
||||
a) Ranked in Top 50% of Residual Growth, 82-87 |
0.13*** (0.03) |
0.12*** (0.04) |
||
b) Ranked in Top 50% of Residual Growth, 82-87 & 77-82 |
0.02 (0.05) |
- 0.01 (0.06) |
||
c) Ranked in Top 25% of Residual Growth, 82-87; Top 50%, 77-82 |
0.00 (0.07) |
0.05 (0.09) |
||
d) Ranked in Top 25% of Residual Growth, 82-87 & 77-82 (Heroic) |
0.07 (0.08) |
0.10 (0.10) |
||
Heroic Plant Total (a + b + c + d) |
0.13 |
0.12 |
||
|
3) Plant Investment in 1987 |
||||
|
A. Investment in Structures and Equipment Per Employee |
||||
|
1987 |
%D ,77-87 |
|||
|
Exceptional Grower Ranking |
||||
a) Ranked in Top 50% of Residual Growth, 82-87 |
0.08* (0.04) |
0.08 (0.06) |
||
b) Ranked in Top 50% of Residual Growth, 82-87 & 77-82 |
0.08 (0.06) |
- 0.09 (0.08) |
||
c) Ranked in Top 25% of Residual Growth, 82-87; Top 50%, 77-82 |
0.00 (0.08) |
0.15 (0.11) |
||
d) Ranked in Top 25% of Residual Growth, 82-87 & 77-82 (Heroic) |
0.00 (0.10) |
- 0.33*** (0.13) |
||
Heroic Plant Total (a + b + c + d) |
0.00 |
- 0.33 |
||
|
B. Investment in Structures & Equipment / Value Added |
||||
|
1987 |
D ,77-87 |
|||
|
Exceptional Grower Ranking |
||||
a) Ranked in Top 50% of Residual Growth, 82-87 |
0.11** (0.04) |
0.09 (0.06) |
||
b) Ranked in Top 50% of Residual Growth, 82-87 & 77-82 |
0.01 (0.06) |
- 0.04 (0.08) |
||
c) Ranked in Top 25% of Residual Growth, 82-87; Top 50%, 77-82 |
0.11 (0.09) |
0.19* (0.11) |
||
d) Ranked in Top 25% of Residual Growth, 82-87 & 77-82 (Heroic) |
- 0.11 (0.10) |
- 0.40*** (0.13) |
||
Heroic Plant Total (a + b + c + d) |
0.11 |
- 0.40 |
||
|
C. Investment in Structures & Equipment / Capital Stock |
||||
|
1987 |
D ,77-87 |
|||
|
Exceptional Grower Ranking |
||||
a) Ranked in Top 50% of Residual Growth, 82-87 |
0.27*** (0.04) |
0.24*** (0.06) |
||
b) Ranked in Top 50% of Residual Growth, 82-87 & 77-82 |
0.06 (0.06) |
- 0.01 (0.09) |
||
c) Ranked in Top 25% of Residual Growth, 82-87; Top 50%, 77-82 |
0.10 (0.08) |
0.17 (0.12) |
||
d) Ranked in Top 25% of Residual Growth, 82-87 & 77-82 (Heroic) |
- 0.05 (0.10) |
- 0.31** (0.14) |
||
Heroic Plant Total (a + b + c + d) |
0.27 |
- 0.07 |
||
Alexander, Lewis, "Technology, Economic Growth and Employment: New Research from the Department of Commerce," Economics and Statistics Administration, Office of the Chief Economist, December, 1994.
Amirkhalkhali, Saleh, and Arun K. Mukhopadhyay, "The Influence of Size and R&D on the Growth of Firms in the U.S.," Eastern Economic Journal, Vol. 19, No. 2, Spring, 1993.
Baily, Martin Neil, Bartelsman, Eric J. and John Haltiwanger, "Labor Productivity: Structural Change and Cyclical Dynamics," Mimeo, Center for Economic Studies, Bureau of the Census, March, 1995.
Baily, Martin Neil, Bartelsman, Eric J. and John Haltiwanger, "Downsizing and Productivity Growth: Myth or Reality?" NBER Working Paper 4741, May, 1994.
Baily, Martin Neil, Hulten, Charles and David Campbell, "Productivity Dynamics in Manufacturing Plants," Brookings Papers: Microeconomics, 1992, The Brookings Institution, Washington, DC.
Baldwin, John, Chandler, William, Can Le and Tom Papailladis, "Strategies for Success: A Profile of Growing Small and Medium-Sized Enterprises (GSMEs) in Canada," Statistics Canada, February 1994.
Bartelsman, Eric J. and Phoebus J. Dhrymes, "Productivity Dynamics: U.S. Manufacturing Plants, 1972-1986," Center for Economic Studies Discussion Paper #92-1, U.S. Bureau of the Census, 1992.
Bartelsman, Eric J. and Wayne B. Gray, "NBER Productivity Database," National Bureau for Economic Research, September 9, 1994.
Beede, David N. and Kan H. Young, "Patterns of Advanced Technology Adoption and Manufacturing Performance: Employment Growth, Labor Productivity, and Employee Earnings," Economics and Statistics Administration, ESA/OPD, 96-1, February 1996.
Bernard, Andrew and J. Bradford Jensen, "Exporters, Skill Upgrading and the Wage Gap," Journal of International Economics, 1997.
4 4 4 , "Exporters, Jobs, and Wages in U.S. Manufacturing: 1976 - 1987," Brookings Papers: Microeconomics, 1995.
Caballero, Ricardo J. and Eduardo M. R. A. Engel, "Microeconomic Adjustment Hazards and Aggregate Dynamics," The Quarterly Journal of Economics, May, 1993.
Caballero, Ricardo J., Engel, Eduardo M. R. A. and John C. Haltiwanger, "Aggregate Employment Dynamics: Building from Microeconomic Evidence," American Economic Review, March, 1997.
Davies, Stephen. The Diffusion of Process Innovations. London / New York: Cambridge University Press, 1979.
Davis, Steve, Haltiwanger, John and Scott Schuh. Job Creation and Destruction. Cambridge (MA): The MIT Press, 1996.
Doms, Mark, "Estimating Capital Efficiency Schedules within Production Functions," Economic Inquiry, 1996?.
Doms, Mark and Timothy Dunne, "Capital Adjustment Patterns in Manufacturing Plants," Center for Economic Studies Working Paper 94-11, U. S. Bureau of Census, August, 1994.
Doms, Mark, Dunne, Timothy J. and Mark J. Roberts, "The Role of Technology Use in the Survival and Growth of Manufacturing Plants," International Journal of Industrial Organization, Vol. 13, No. 4, December, 1995.
Doms, Mark, Dunne, Timothy J. and Kenneth Troske, "Workers, Wages and Technology," Quarterly Journal of Economics, 1997 (forthcoming).
Dunne, Timothy J., "Plant Age and Technology Use in US Manufacturing Industries," The RAND Journal of Economics, Vol. 25, No. 3, Autumn, 1994.
Dunne, Timothy J. and David A. MacPherson, "Unionism and Gross Employment Flows," Southern Economic Journal, January, 1994.
Dunne, Timothy and Mark J. Roberts, "The Long-Run Demand for Labor: Estimates from Census Establishment Data," Center for Economic Studies Working Paper 93-13, September, 1993.
Dunne, Timothy, Roberts, Mark J. and Larry Samuelson, "The Growth and Failure of U.S. Manufacturing Plants," The Quarterly Journal of Economics, 1989a.
, "Plant Turnover and Gross Employment Flows in the U.S. Manufacturing Sector," Journal of Labor Economics, 1989b.
Dunne, Timothy and James A. Schmitz, Jr., "Wages, Employment Structure and Employer Size-Wage Premia: Their Relationship to Advanced-Technology Usage at US Manufacturing Establishments," Economica, Vol. 62, February, 1995.
Dwyer, Douglas W., "Productivity Races II: The Issue of Capital Measurement," Center for Economic Studies Working Paper 97-3, March, 1997.
…………………., "Are Fixed Effects Fixed? Persistence in Plant Level Productivity," Center for Economic Studies Working Paper 96-3, May, 1996.
Evans, David, "The Relationship Between Firm Growth, Size, and Age: Estimates for 100 Manufacturing Industries," The Journal of Industrial Economics, 1987a.
....................., "Tests of Alternative Theories of Firm Growth," Journal of Political Economy, 1987.
....................., "Gibrat’s Law, Firm Growth, and the Fortune 500," Working Paper, Starr Center for Applied Economics, New York University, September 1986.
Ewers, Hans-Jürgen, Becker, Carsten and Michael Fritsch. Wirkungen des Einsatzes Computergestützter Techniken in Industriebetrieben. Berlin and New York: Walter de Gruyter, 1990.
Hall, Bronwyn, "The Relationship Between Firm Size and Firm Growth in the U.S. Manufacturing Sector," The Journal of Industrial Economics, 1987.
Haltiwanger, John, "Small Business and Job Creation in the United States: What Do We Know?" Mimeo, Center for Economic Studies, 1997.
Hamermesh, Daniel S. Labor Demand. Princeton, NJ: Princeton University Press, 1993.
Hart, Peter E. and Nicholas Oulton, "Growth and Size of Firms," The Economic Journal, Vol. 106, September, 1996.
Hoel, Paul G., "Introduction to Mathematical Statistics," 4th Edition. New York: John Wiley & Sons, Inc., 1971.
Ijiri, Yuji and Herbert Simon, "A Model of Business Firm Growth," Econometrica, Vol. 35, No. 2, April, 1967.
Ijiri, Yuji and Herbert Simon, "Business Firm Growth and Size," American Economic Review, Vol. 54, March, 1964.
Jensen, J. Bradford and Robert H. McGuckin, "Firm Performance and Evolution: Empirical Regularities in the Microdata," December, 1995.
Jensen, J. Bradford and Nathan Musick, "Trade, Technology and Plant Performance," Economics and Statistics Administration, ESA/OPD, 96-4, February 1996.
Jovanovic, Boyan, "Selection and the Evolution of Industry," Econometrica, 1982.
Leonard, Jonathan S., "In the Wrong Place at the Wrong Time: The Extent of Frictional and Structural Unemployment," in Unemployment and the Structure of Labor Markets, Kevin Lang and J. Leonard, eds. New York: Basil Blackwell, 1987.
Lucas, Robert E., Jr., "On the Size Distribution of Business Firms," The Bell Journal of Economics, Vol. 9, No. 2, 1978.
Mansfield, Edwin, "Entry, Gibrat’s law, Innovation, and the Growth of Firms," American Economic Review, Vol 52, 1962.
McGuckin, Robert H., Streitweiser, Mary L. and Arnold P. Reznek, "The Impact of Ownership Change on Employment, Wages, and Labor Productivity in U.S. Manufacturing," Center for Economic Studies Working Paper 95-8, , April, 1995.
McGuckin, Robert H., Steitwieser, Mary L. and Mark Doms, "The Effect of Technology Use on Productivity Growth," Center for Economic Studies Discussion Paper 96-2, U.S. Census Bureau, 1995.
McKinsey Global Institute. Capital Productivity. Washington, DC: June, 1996.
Nelson, Richard R. and Sidney G. Winter. An Evolutionary Theory of Economic Change. Cambridge (MA): The Belknap Press of Harvard University Press, 1982.
Pakes, Ariel and Richard Ericson, "Empirical Implications of Alternative Models of Firm Dynamics," NBER Working Paper 2893, March 1989.
Roberts, M. J. and D. Supina, "The Magnitude and Persistence of Output Price Dispersion for U.S. Manufactured Products," mimeo, Center for Economic Studies, U.S. Bureau of Census, 1994.
Saunders, Norman C., "Employment Effects of the Rise and Fall in Defense Spending," Monthly Labor Review, April, 1993.
Simon, Herbert A. and Charles P. Bonini, "The Size Distribution of Business Firms," American Economic Review, Vol. 48, September, 1958.
Singh, Ajit and Geoffrey Whittington, "The Size and Growth of Firms," Review of Economic Studies, Vol. 52, January, 1975.
Stoneman, Paul, "Intra-firm Diffusion, Bayesian Learning and Profitability," The Economic Journal, Vol. 91, June, 1981.
Sutton, John, "Gibrat’s Legacy," Journal of Economic Literature, Vol. 35, March, 1997.
Troske, Kenneth, "The Time-Series Pattern of Firm Growth in Two Industries," Center for Economic Studies Discussion Paper 92-10, September 1992.
United States Department of Commerce, Economics and Statistics Administration, "Fixed Reproducible Tangible Wealth in the United States, 1925 - 1989," January 1993.
Variyam, Jayachandran N. and David S. Kraybill, "Empirical Evidence on Determinants of Firm Growth," Economics Letters, Vol. 38, 1992, pp. 31 - 36.
White, H., "A Heteroscedasticity-Consistent Covariance Matrix Estimator and a Direct Test for Heteroscedasticity," Econometrica, 1980.