
Intellectual property and the valuation of biotechnology
companies: GEN-dex versus Dow Jones.
Valuation of biotechnology companies is a perplexing
issue. The common method of deriving company's worth by discounting
its free cash flow is not of much help, since cash flow in most
of the biotechnology sector is usually still negative (e.g. there
is more cash going out than coming in). Still, biotechnology companies
are traded, in various stock exchanges, with a considerable positive
value. Clearly the value of a company that looses money, as is
the case for most of the biotechnology sector, is based on its
potential for future earnings. In biotechnology it is generally
accepted that such potential is closely linked to the intellectual
property owned by the company. Thus, we might expect that the
value of a biotechnology company should mainly reflect the value
of its intellectual assets.
Is this presumption supported by the real world data?
Apparently it does, as will be shown in this article.
Valuation Concepts: Tangible and Intangible
assets.
(the following method of analysis is described with much rigor in: Gordon V. Smith & Russell L. Parr, "Intellectual Property: Licensing and Joint Venture Profit Strategies", John Wiley & Sons, 1993).
Conceptually the value of a company is the sum of
its assets value. However accounting procedures allow companies
to reflect only the tangible part of there assets. Tangible assets
include current assets, which are assumed to be equivalent to
cash, and fixed assets which generate part of the firm's earnings.
Unfortunately the accounting profession has not developed yet
an accepted method to record intangible assets. These assets include:
employees training, know-how, brand nams, trademarks, copyrights
and patents. Although financial statements can reflect only a
portion of a firm's value, markets evaluate companies according
to the full scope of their assets. Thus, we can estimate the value
of the intellectual assets of a firm by examining market data.
We begin with the significant insight, initially
presented by Modigliani & Miller ("The Cost of Capital,
Corporation Finance, and the Theory of Investment," AER,
June 1958), that the value of a firm is the sum of its equity
market value and its debt market value. Debt market value is usually
assumed to be equal to the respective book value, and thus we
can calculate the firm's market value as the sum of its market
capitalization and the book value of its current liabilities and
long term debt. The difference between the firm's market value
and its assets book value is a fair estimate to its intangible
assets worth.
The weight of intellectual property in the determination
of the firm's value can be measured by the ratio of intangible
assets worth to the firm's market value. I have named this ratio:
the Intellectual Property (IP) Intensity. The IP Intensity has
some desirable properties making it a good mean of comparison
between different companies. Since the tangible assets value is
always positive, the IP Intensity must be, by definition, less
than one. Intangible assets value can be negative, usually when
the market is very pessimistic about the firm's prospects. However,
we can discard this possibility as anomaly and thus the IP intensity
will vary between zero to one. Firms with IP intensity close to
zero derive their value mainly from their tangible assets, while
values close to one characterize IP intensive companies, which
derive most of their value from their intellectual assets.
Equipped with these analytic tools we can move forward
to analyze the biotechnology sector. More specifically I am interested
in the IP intensity of the biotechnology sector in comparison
to general industry norm. I have used two samples of companies:
(1) the GEN index (GEN-dex) of 46 U.S. biotechnology companies;
(2) the Dow-Jones index of 30 large U.S. industrial companies.
All the data presented below are for the first quarter of 1997.
GEN-dex Companies.
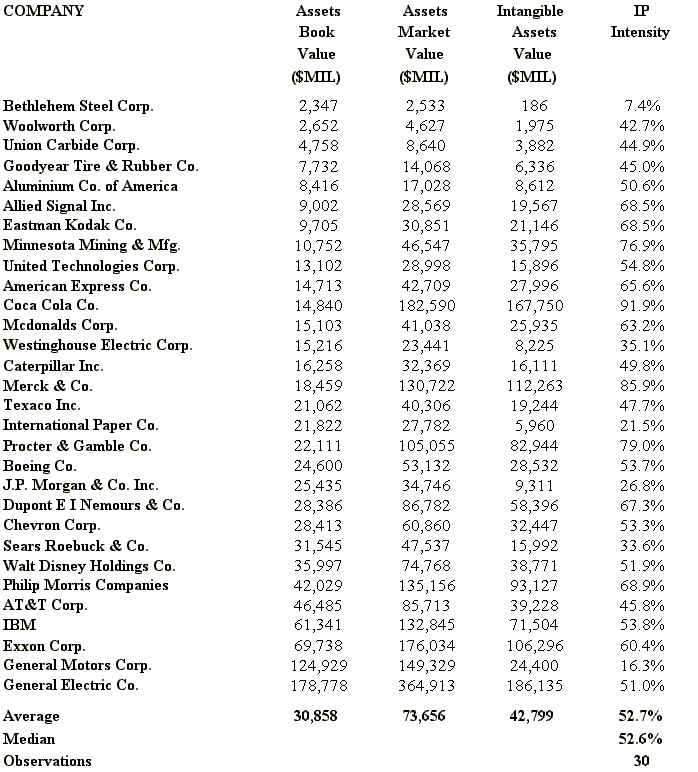
The relevant data for the GEN-dex companies are presented
in Table 1. The companies are sorted by their assets book value,
which is linked to their size. The tangible assets in the average
GEN-dex company worth $285 millions, while the intangible assets
worth - $850 millions - is almost threefold. The IP intensity
average and median range between 72%-73%.
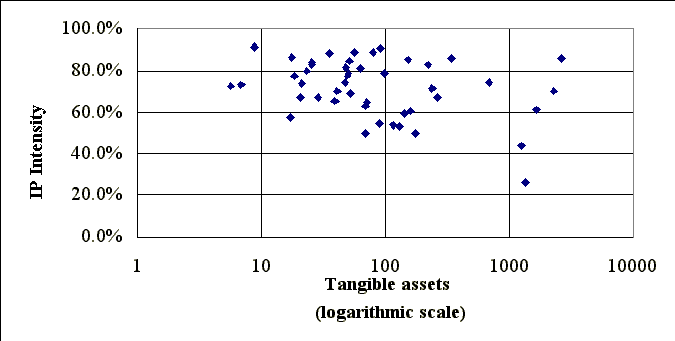
The relation between intangible assets and tangible assets is shown in Diagram 1. Apparently there is a positive correlation between the two. Firms with high tangible assets value, which will usually be larger also in terms of sales and number of employees, tend to have higher value of intangible assets. However this relation does not hold for the IP intensity, as demonstrated by Diagram 2. Since IP intensity is not correlated to the size of the firm, it is more suitable as a measure to compare intellectual property role in firms with different sizes.
Table 1: GEN-dex companies
Diagram 1: Intangible Assets (GEN-dex)
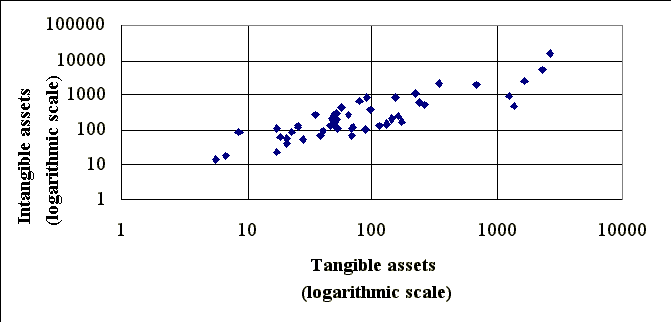
Diagram 2: Intellectual Property (IP) Intensity (GEN-dex)
Dow-Jones Companies.
Similarly, the Dow-Jones companies are presented
in Table 2 sorted according to their size. The average Dow-Jones
company tangible assets value is close to $31 billions, more than
100 times larger than the average GEN-dex company. However the
intangible assets value of the average Dow-Jones company - $43
billions - is only 50 times larger than the equivalent value in
the average GEN-dex company. The IP intensity average and median
in the Dow-Jones companies are both around 53% which is considerably
lower than the equivalent values in the GEN-dex companies.
Table 2: Dow Jones companies
Diagrams 3 and 4 show that intangible assets measures
in the Dow-Jones companies have the same properties as their equivalent
measures in the GEN-dex. Intangible assets value is positively
correlated with the firm's size, while IP intensity is independent
of such size.
Diagram 3: Intangible Assets (Dow Jones)

Diagram 4: Intellectual Property (IP) Intensity (Dow Jones)

GEN-dex versus Dow-Jones
The previous discussion has already suggested that
GEN-dex companies are more IP intensive than the Dow-Jones companies.
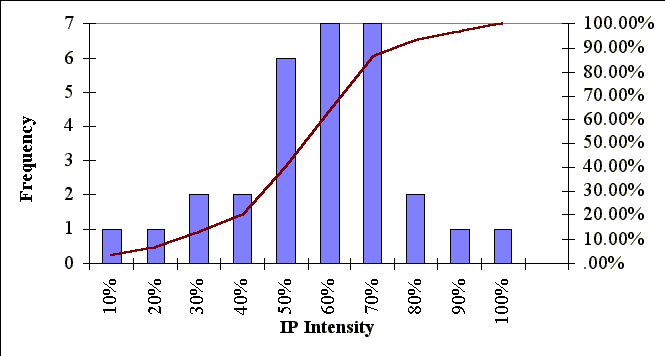
To elaborate this point, the IP intensity distributions were analyzed,
and are presented in Table 3, while the histograms are presented
in Diagrams 5 and 6. The results are illuminating. The GEN-dex
IP intensity distribution is highly asymmetric and skewed to the
right. About three quarters of the observations lie the IP intensity
range of 60% to 90%. The Dow-Jones IP intensity distribution is
more symmetric, almost bell shaped. About two thirds of the observations
lie in the IP intensity range of 40% to 70%.
Table 3: Distribution of IP Intensity
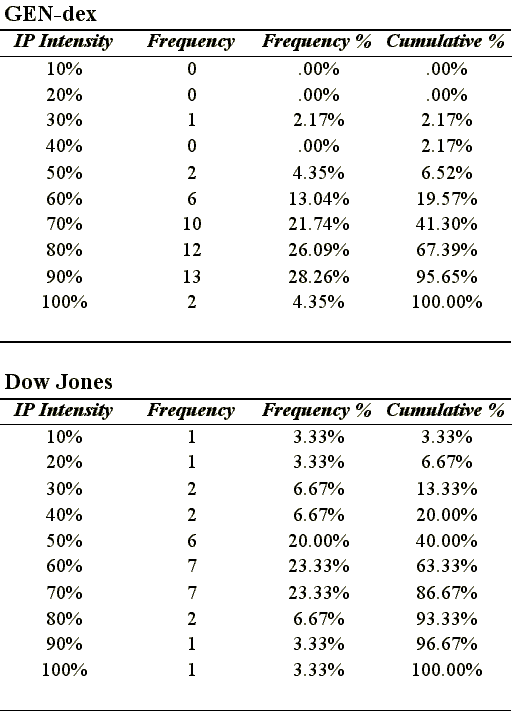
Diagram 5: Distribution of IP Intensity (GEN-dex)

Diagram 6: Distribution of IP Intensity (Dow Jones)
Thus, by using market data, I have demonstrated that
biotechnology sector is considerably more IP intensive than the
industrial norm. As common sense suggests, intellectual property
is the major determinant of value in the biotechnology sector.
Appendix: Intellectual Property Intensity (IPI)
- a mathematical representation
As a starting point we can use the basic identities
of the balance sheet:
(1) ABV = CA + NFA = EBV + DBV
ABV - Assets Book Value
CA - Current Assets
NFA - Net Fixed Assets
EBV - Equity Book Value
DBV - Debt Book Value
Next we will use the definition of the firm's value
proposed by Modigliani & Miller:
(2) AMV = EMV + DMV
AMV- Assets Market Value, which according to M&M, is the firm's market value and is equal to its discounted sum of future net operating income (income before interest payments minus tax).
EMV - Equity Market Value.
DMV - Debt Market Value.
Now we will assume that debts book value is equal
to its market value (which is usually not observable).
(3) DMV = DBV
Thus (2) becomes:
(4) AMV = DBV + EMV
Equation (4) defines AMV by combining the balance
sheets figures with its market data.
Now we can define the ratio:
(5) AMBV = AMV/ABV
AMBV- Assets Market to Book Value.
And we can define the Intellectual Property Intensity
(IPI):
(6) IPI = (AMV - ABV)/AMV
Inserting (5) into (6) we can get the relation between
these two measures:
(7) IPI = 1 - AMBV-1
(8) AMBV = 1/(1 - IPI)
IPI cannot exceed 1 by definition, and thus AMBV
is always defined and positive. In normal cases IPI will also
be larger or equal to zero, and thus AMBV will be larger or equal
to 1. As the preliminary findings show, IPI is not dependent on
the size of the firm and the same conclusion holds for AMBV too.
For illustration purpose we present the AMBV and
IPI for selected companies (data are for the first quarter of
1997):
| Company | ||
| Amgen | ||
| Genentech | ||
| Chiron | ||
| Merck | ||
| IBM | ||
| General Electric | ||
| General Motors |
AMBV ratio to can be use as an estimate of value and is superior
to P/E or P/B ratios.
P/E is meaningless when the firm does not have profits, as is
the case with many start-up companies, and moreover earnings can
be manipulated by different accounting methods (a recent article
in the Economist describes the case of Daimler-Benz, that due
to its listing in NYSE in 1993, had to change its report of $372
millions profit under German accounting rules to $1.1 billion
loss under American rule).
P/B is not robust and depends on the firms capital structure.
To illustrate this let's look at a firm that is financed only
by equity. Thus, its P/B ratio will be:
(9) (P/B)0 = AMV/ABV = AMBV
Now suppose that the same firm is financed by debt and equity.
If we accept the M&M theorem, the firm's AMV should remain
the same. Thus its P/B ratio will be:
(10) (P/B)1 = (AMV - DMV)/(ABV - DBV)
Which according to (3) can be rewritten as:
(11) (P/B)1 = (AMV - DBV)/(ABV - DBV)
It can be easily shown that:
(12) (P/B)0 (P/B)1 if AMV ABV (e.g. AMBV 1)