Best Log-linear Index Numbers:
Extensions and Applications
Eric Blankmeyer
Department of Finance and Economics
Southwest Texas State University
San Marcos, Texas 78666
Tel. 512-245-3253
e-mail eb01@swt.business.edu
Abstract. Index numbers of prices and quantities
are estimated in the framework of a two-way
analysis of variance, based on the ideas of
H. Theil and K. Banerjee. Topics include
aggregation, multidimensional indices, and
non-spherical errors. The method is applied
to the commodity exports of developing
nations.
Copyright (c) 1997 Eric Blankmeyer
Best Log-linear Index Numbers: Extensions and Applications
Introduction
Price and quantity indices have usually been treated as
descriptive statistics. However, Blankmeyer (1990) showed that
standard econometric methods can be applied to estimate index
numbers and to test hypotheses about rates of change in prices
and quantities. This shift from description to inference is based
on three ideas.
First, index numbers should be derived using all the sample
observations jointly. In the conventional approach, a "base
period" is selected more or less arbitrarily. The remaining
observations are then compared to the base period one at a time.
This pairwise formula makes little sense if the construction of
indices is approached as an estimation problem.
Second, there can be no unique estimate of the actual level
of a price or quantity index. Only rates of change are
identifiable since there is one degree of freedom in scaling each
index.
Third, prices and quantities are to be treated symmetrically.
For the price index, the weights should be computed from all the
quantity data, while all the price data should be taken into
account in weighting the quantity index.
No doubt these ideas have been advocated more than once in
the vast literature on index numbers. From this author's
viewpoint, they are a synthesis of several papers that appeared
more than thirty years ago. Henri Theil (1960) made a strong case for
indices derived symmetrically and jointly from all the
observations. His eigenvalue formulas are "closely related to
principal-component analysis....There is a difference from the
usual type of principal-component analysis in that we consider
here two sets of variables, viz., prices and quantities" (p.
465).
This remark suggests that Theil's indices are also related to
canonical correlation; indeed, they maximize a zero-order moment
in the two sets of variables. Interestingly, Gerhard Tintner
(1952) applied canonical correlation explicitly to index numbers.
However, he adopted a curious approach, in effect multiplying the
price of apples by the quantity of oranges ! Most researchers,
including Theil, have preferred to multiply the price of apples
in one period by the quantity of apples in another period; they then
repeat the process for oranges and aggregate the results. This is
the approach taken in the present paper.
Kali Banerjee pointed out that index numbers fit naturally
into the format of a two-way analysis of variance (ANOVA). He
developed this least-squares treatment for the pairwise model
(base year/current year) in a series of papers during the 1950s
and 1960s. They are summarized in two monographs [Banerjee (1975,1977)].
Subsequently, D. S. Prasada Rao, Banerjee and others (1986,1995) extended the ANOVA method to handle multinational price indices. This is the
spatial counterpart of the idea that all time periods should be
considered jointly.
In their seminal papers, these researchers continued to
treat index numbers as descriptive statistics. They do not seem
to have formulated an estimation problem, nor did they propose
hypothesis tests. However, their methods lead to the best
log-linear (BLL) index numbers, which are briefly reviewed in the
next section.
The present paper has several objectives. It discusses
concisely how the BLL method can handle problems of aggregation,
multiple factors, and nonspherical errors. Next, some of these
concepts are applied to exports of raw materials from developing
nations between 1976 and 1985. The paper concludes with remarks
on the "statistical" and "economic" approaches to index numbers.
BLL Indices
Multiperiod index numbers are based on the hypothesis of
equiproportional variation. If, from one period to the next, all
commodity prices changed in lockstep, and if the
corresponding quantities also rose or fell in tandem, then the
computation of indices would be straightforward. However,
allowance must be made for random departures from lockstep. Given
T joint observations on K commodities, let exp(vrt) =
SkPrkQtkdenote the aggregate value when the prices of period r are
applied to the quantities of period t. The validity of
equiproportional variation can be tested in the log-linear model:
vrt = pr + qt + z + ert , r, t = 1, ..., T. (1)
The period-r log price index, pr, and the period-t log quantity index,
qt, are unknown parameters that must be estimated, as is the intercept, z.
The unobserved errors, ert, account for the failure of prices and quantities to change in lockstep. If ert conforms to the assumptions of the Gauss-Markov
theorem, then application of ordinary least squares (OLS) to equation (1) leads to the two-way ANOVA model.
It is well known that the "independent variables" for that model are a set of dummies (0's and 1's) subject to two linear dependencies [F. A. Graybill (1976), ch. 14]. As stated earlier, these dependencies simply mean that the levels of the price and quantity indices cannot be determined uniquely. Only the log-linear contrasts, pr-pt and qr-qt are identifiable; they measure the percent change in the levels of their respective indices.
Under the arbitrary but convenient normalizations Spr = Sqt = 0, application of OLS produces the familiar two-way ANOVA solution:
z = SSvrt/T2,
pr = Stvrt/T - z, and (2)
qt = Srvrt/T - z ,
The residuals
ert = vrt - pr - qt - z (3)
are in turn the basis for an unbiased estimate of the error variance:
s2 = SSert/(T-1)2 (4).
If it can be assumed that the unobserved errors are spherical
normal variables, then hypothesis tests are readily available.
Blankmeyer (1990) gives several examples. For instance, the
statistic
(pr - pt - p) / (2s2/T)1/2 (5)
has Student's distribution with (T-1)2 degrees of freedom on the
null hypothesis that the percent change in the price level was p
between periods r and t.
Of course, the assumption of spherical normal errors is
fairly drastic and may have to be modified. A model with
heteroscedasticity is sketched in the sequel. Blankmeyer (1991)
outlines a robust alternative to OLS for error distributions that
are more diffuse than the normal.
In deference to the descriptive approach to index numbers, it
may be mentioned that the BLL method is an extension of
Irving Fisher's ideal indices. In fact, for T = 2, exp(p2-p1) is
the ideal price index. Unlike conventional (base year/current
year) formulas, the BLL indices meet the circularity test for all
periods in the sample and therefore provide consistent estimates
of rates of change over three or more time intervals.
It is worth noting that the BLL model is not limited to
analyzing time series. The indices r and t may refer to pairs of
cities, nations, or industries. The index numbers may measure the
productivity and utilization of resources rather than the prices
and quantities of goods.
Aggregation.
Often data are available to compute price and quantity
indices for several groups of commodities --for example, food
(f) and clothing (c). An important question is how such indices
should be combined to form an aggregate (a). In the BLL format,
three separate regression equations can be estimated --one each
for f, c, and a. It is no surprise that, in the absence of
restrictions across the equations, the indices for food and
clothing do not add up to the aggregate indices of prices and
quantities.
In fact, it has already been noted that no price and quantity
levels are identifiable in the BLL format. Therefore,
restrictions across equations should involve log changes. For
example, it might be stipulated that the percent change in the
aggregate price level is a weighted average of the percent
changes in food and clothing prices:
wf(pfr-pft) + wc(pcr-pct) - (par-pat) = 0 (6).
Here wf and wc are weights for food and clothing (wf, wc > 0,
wf+wc = 1). Now equation (6) raises two further issues: For which
periods (r,t) are the restrictions to apply ? And how are the weights
(wf, wc) to be chosen ?
In the first place, the unrestricted BLL indices have been
estimated with just (T-1)2 degrees of freedom, so it is pointless
to impose restrictions for all T(T-1)/2 price changes and an
equal number of quantity changes ! To achieve parsimony and make
allowance for sampling error, the restrictions might be imposed
only for the first and last periods. Indeed, all T observations are
represented in the term paT - pa1 =
S(pat - pat-1), where the summationruns from 2 to T. The interpretation would be that consistency in aggregation is to be expected on average, if not for each time interval:
wf(pfT-pf1) + wc(pcT-pc1) - (paT-pa1) = 0 (7).
As for the choice of weights, the BLL approach is to derive
the price and quantity indices symmetrically using all the data
in the sample. Each price change is weighted by the quantities
averaged over all periods, and each quantity change is weighted
by the prices averaged over all periods. There is no need to
choose an arbitrary "base period" which is perhaps not even in
the sample. Unfortunately, this BLL principle is not easily
extended to wf and wc in equation (7). For if these cross-equation
weights are to be estimated jointly with the price changes, the
problem becomes nonlinear. Then the computational simplicity and the hypothesis tests of the general linear model must be relinquished.
For practical purposes, therefore, the across-equation
weights will have to be "prior information." If wf and wc are the
value shares of food and clothing in some reference period, the
restriction (7) is linear after all. Since the three equations
(for f, c and a) have identical independent variables (just the
ANOVA dummies), it is of no advantage to use seemingly-unrelated
regression across equations. In fact, the usual restricted
least-squares estimator for a single equation is applicable [e.g.
Johnston (1984), chapter 6]. Moreover, the ANOVA structure
permits further simplifications:
1. Using equations (2), obtain the three sets of unrestricted
BLL estimates.
2. It turns out that restriction (7) changes only the
estimates for periods 1 and T; the estimates for all
other periods are unaffected.
3. For food, the adjusted log price index numbers are:
pf1 +
lpwf / T(8)
and pfT - lpwf / T
where the Lagrange multiplier for restriction (7) is
T[ wf(pfT-pf1) + wc(pcT-pc1) - (paT-pa1) ]
lp = _________________________________ (9)
2(wf2 + wc2 + 1)
4. For clothing, equation (8) applies with f replaced by c.
For the aggregate index, equation (8) applies with f
replaced by a and with wa = -1.
The quantity index also requires a restriction like (7):
wf(qfT-qf1) + wc(qcT-qc1) - (qaT-qa1) = 0 . (7')
This leads to an adjustment factor lq , a Lagrange multiplier analogous to expressions (8) and (9), with qf, qc, and qa instead of pf, pc and pa. On the null hypothesis that the BLL index numbers aggregate consistently, the test statistic F = (lp2 + lq2)(wf2 + wc2 + 1)/Ts2 has an F distribution with 2 and
(T-1)2 degrees of freedom. The hypothesis of consistent aggregation is rejected if F exceeds the tabular value at a specific level of significance.
Equations (7), (7'), (8), and (9) may be extended in an obvious way
to handle aggregation over more than two commodity groups.
Multidimensional Indices
Although the discussion has focused on the analysis of
prices and quantities, Banerjee (1977) showed how to generalize
the ANOVA model to handle additional factors. As an illustration
involving spatial comparisons, suppose that data are available on
K commodities in T states of the USA. During a given year, every
state has recorded, for each good, the volume sold, the ad
valorem rate of sales tax, and the tax revenue collected.
Summation over commodities then leads to the log-linear model:
vrts = z + pr + qt + hs + erts , (10)
where exp(vrts) is the aggregate revenue that would be obtained
if the tax rates of state s were applied to the quantities sold
in state t at the prices prevailing in state r. The three-way
ANOVA would estimate interstate differences in price levels,
sales volume, and tax rates. Compared to state s, state t might
have higher tax rates on some items and lower rates on others.
The estimate of hs-ht would be the basis for testing whether, on
average, the tax rates in the two states are equal. Graybill
[(1976), ch. 15] discusses inference in the three-way ANOVA
design.
Nonspherical Errors
The OLS solution [equations (2)] is based on spherical
errors, ert. However, the sample may be contaminated by either
heteroscedasticity or autocorrelation. In principle, efficient
estimates are then achieved by the generalized least-squares
(GLS) transformation. In practice, the nonspherical pattern must
be inferred from the OLS residuals. For finite samples, this "feasible"
GLS estimator is not guaranteed to improve on OLS and could be
much worse if the researcher's hunch about the error pattern is mistaken. Accordingly, the examination of residuals is best undertaken in a
"what if" spirit, not as a formal exercise in statistical inference.
The BLL data, vrt, are doubly dimensioned, perhaps as a time
series, perhaps as a cross section of states or industries. This
unusual structure should be reflected in conjectures about the
error pattern. For example, one might specify that
Var(ert) = variance because prices aren't in lockstep
+ variance because quantities aren't in lockstep
+ covariance because prices and quantities aren't
in lockstep.
Suppose that the first two error components are constant for
all r and t, while the covariance depends on the proximity of the
prices and quantities. Specifically,
Var(ert) = b0 + b1cd (11)
where b0 > 0, 0 < c < 1 and d = |r-t|. Equation (11) covers
several cases:
o If b1 = 0 or c = 0, the errors are homoscedastic and OLS
applies.
o If b1 < 0 while b0 > -b1, the contemporaneous data (r = t)
are the most reliable, and the variance increases at longer
lags.
o If b1 > 0, the contemporaneous data are the least reliable.
Equation (11) can be implemented by regressing ert2 on cd for
several values of c and choosing the value that fits best. Then equations
(2) are applied to the transformed observations vrt/(b0+b1cd). (One
might think that the denominator should be under a square-root sign.
It would be if the ANOVA design matrix were also transformed to be used explicitly in a regression program. However, no such heavy computations are required.)
Exports of Raw Materials, 1976-1985
This section updates a previous study [Blankmeyer (1990)] in
which the BLL method was applied to the commodity exports
of developing nations. For the 33 raw materials listed in Table
1, the World Bank (1988) reports the quantities exported and the
corresponding dollar prices (unit values). These annual series
span 1976-1985, when commodity prices rebounded from a slump but
then plummeted to record low levels in the recession of 1981-1983.
In terms of equations (2), T = 10, so the sample includes T2 = 100 observations.
With the minor exception of manganese ore, the items
in Table 1 comprise the World Bank's value-weighted (VW) index.
Each commodity's weight is its average value share in 1979-1981.
The World Bank (1988, Table 21) deflates the VW price index by
the cost of manufactures to obtain a terms-of-trade series. In
the present paper, however, the undeflated VW price and quantity
indices are compared to the respective BLL indices.
TABLE 1
Principal Commodity Exports of Developing Nations
Food and Beverages Non-food Agriculture
1. cocoa (3.6) 19. cotton (4.6)
2. coffee (14.3) 20. jute (0.3)
3. tea (2.2) 21. rubber (5.4)
4. grain sorghum (0.8) 22. timber (8.1)
5. maize (2.5) 23. tobacco (2.7)
6. rice (3.8)
7. wheat and meslin (1.3) Metals and Minerals
8. sugar (12.3) 24. aluminum (1.4)
9. beef (2.0) 25. bauxite (1.2)
10. bananas (1.5) 26. copper (7.9)
11. oranges, etc. (1.2) 27. nickel (1.4)
12. copra (0.2) 28. tin (3.6)
13. groundnuts (0.5) 29. lead (1.0)
14. soybeans (1.5) 30. zinc (0.8)
15. coconut oil (1.1) 31. iron ore (4.4)
16. groundnut oil (0.4) 32. manganese ore (0.5)
17. palm oil (2.0) 33. phosphate rock (1.9)
18. oilseed cake and meal (3.6)
1979-81 average value shares (percentages) appear in parentheses.
Source: World Bank (1988), Tables 10 and 11.
The main results of applying the World Bank data to equations
(2), (3), and (4) may be summarized as follows:
o The average annual change in the BLL price index is 1.5
percent.
o Coincidentally, the average annual change in the BLL
quantity index is also 1.5 percent.
o Each of these average annual changes is subject to an
estimated standard deviation of 0.27 percent.
o The coefficient of determination, R2, exceeds 0.99,
indicating strong support for the hypothesis of lockstep
variation in prices and quantities.
o To screen for "outliers" in the data, the robust version of
the BLL model [Blankmeyer (1991)] was also computed. The
resulting indices are very similar to the OLS estimates, so
the sample seems to be free of extreme observations.
o The test for nonspherical errors, mentioned in a previous
section, leads in this case to a corner solution: c = 0. In
other words, the error variance does not appear to change
systematically with the lag |r-t|.
The last two conclusions are bolstered to some extent by a
casual perusal of the vrt data themselves; they are all of the
same magnitude since the prices of every year have been applied
to the quantities of every year.
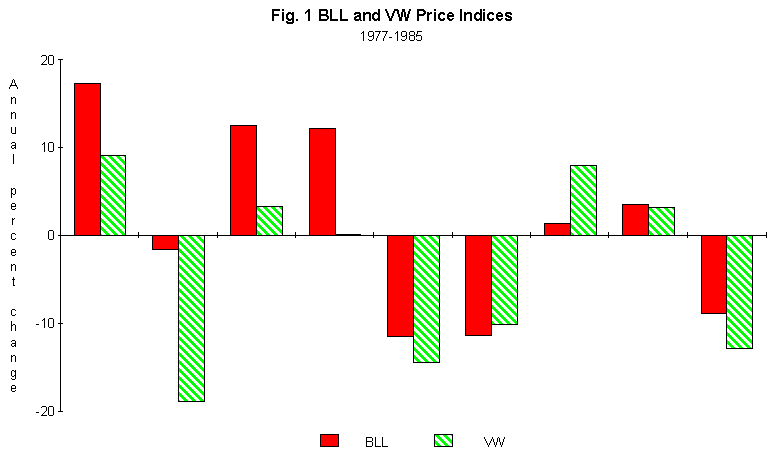
The BLL and VW price indices are compared in Figure 1. They
generally agree on the direction of change if not on the magnitude.Both indices capture the collapse of commodity prices during the recession
of the early 1980s.
The World Bank data illustrate the use of restrictions to
achieve consistency in aggregation. Table 1 displays three
commodity groups and their respective weights --food and
beverages (0.548), nonfood agriculture (0.211), and metals and
minerals (0.241). Equations (2) were used to compute BLL indices
for each group, and the log changes between 1976 (t=1) and 1985
(t=T=10) were evaluated. The Lagrange multipliers are lp = .0049
and lq = -0.0136, so F = 0.161 with 2 and 81 degrees of freedom.
F is so small that one certainly cannot reject the hypothesis that these
BLL price and quantity index numbers aggregate consistently.
"Statistical" and "Economic" Approaches
Theil (1960, p. 464) has mentioned "two distinct lines of
approach to this subject....there is a statistical approach which
is concerned with the specification of a central tendency of
price and quantity ratios that is optimal in some statistical
sense, and there is an economic approach which tries to specify
price indices of varying batches of consumer goods corresponding
with a constant level of satisfaction." _
Like Theil's 1960 paper, the BLL approach is statistical; but
a great deal of the recent literature on index numbers adopts the
economic approach, which has been extended to include production
theory as well as consumer theory. References include Theil
(1965), W. E. Diewert (1976), D. W. Caves et al. (1982), and D.
T. Slesnick (1991).
This modern economic approach to index numbers is based on
the neoclassical theory of competitive markets. Rational
consumers are supposed to maximize well-behaved utility functions
subject to budget constraints, while price-taking firms apply
efficient management to homothetic production processes. It is
further assumed that the utility functions and production
functions, while not directly observable, can be closely
approximated by convex quadratic forms in the logarithms of the
prices and quantities (translog functions). Finally, it is shown
that the index numbers implied by this apparatus are of a certain
type --the Theil-Tornqvist formulas, which are described in the
references just cited.
However, the justifications for these formulas are in a sense
contradictory. On the one hand, they are advocated because of the
ingenious link to the neoclassical paradigm. On the other hand,
the Theil-Tornqvist formulas are touted as "nonparametric": to
compute them, one need not have estimated the substitution
elasticities of the underlying utility functions or production
functions. The sole ingredients are the same raw price and
quantity data used by the BLL method and indeed by most other
index-number formulas.
So while the neoclassical model cum translog approximation
leads to the Theil-Tornqvist formula, the reverse is not true. In
practice, one starts with price and quantity data. Plugging
them into a nonparametric formula, one could never certify that
the underlying utility functions or production functions are
neoclassical. They are not identifiable in this context. The same
point has been emphasized by R. L. Basmann et al. (1983, 1985);
they have exhibited an interesting nonneoclassical utility
function which is observationally indistinguishable from the
neoclassical model.
To state the matter another way, imagine the hapless staff
person in the Trade Ministry who must explain why the nation's
export earnings collapsed last year. To what extent is the
shortfall due to lower world prices ? To what extent is it due to
weak domestic production ? Trying to sort out these effects, she
decides to compute some price and quantity indices. Is it
sensible to recommend that she choose a formula on the basis of
its link --empirically unverifiable-- to the hypothetical
constructs of neoclassical economics ?
The statistical approach to index numbers cannot be dismissed
as "data without theory." The BLL method rests on an hypothesis
that is simple but testable: apart from sampling error, prices
change in lockstep; and so do quantities. As Pindyck and
Rotemberg (1990, p. 1173) remark, "...this co-movement of prices
applies to a broad set of commodities that are largely unrelated,
i.e. for which the cross-price elasticities of demand and supply
are close to zero. Furthermore, the co-movement is well in excess
of anything that can be explained by the common effects of
inflation, or changes in aggregate demand, interest rates, and
exchange rates."
References
Kali S. Banerjee, Cost of Living Index Numbers: Practice,
Precision, and Theory, New York: Marcel Dekker, 1975.
Kali S. Banerjee, On the Factorial Approach Providing the True
Cost of Living, Gottingen, Germany: Vandenhoeck and Ruprecht,
1977.
R. L. Basmann, D. J. Molina, and D. J. Slottje, "Budget
Constraint Prices as Preference Changing Parameters of
Generalized Fechner-Thurstone Direct Utility Functions,"
American Economic Review, June 1983, pp. 411-413.
R. L. Basmann, D. J. Molina, and D. J. Slottje, "On Deviations
between Neoclassical and GFT-Based True Cost-of-Living Indexes
Derived from the Same Demand Function System," Journal of
Econometrics, Oct./Nov. 1985, pp. 45-66.
Eric Blankmeyer, "Best Log-Linear Index Numbers of Prices and
Quantities," Atlantic Economic Journal, June 1990, pp. 17-26.
Eric Blankmeyer, "Robust Estimation of Multiperiod Price and
Quantity Indices," Atlantic Economic Journal, June, 1991, p. 69.
Douglas W. Caves, Laurits R. Christensen, and W. Erwin
Diewert, "Multilateral Comparisons of Output, Input, and
Productivity Using Superlative Index Numbers," Economic Journal,
March 1982, pp. 73-86.
W. E. Diewert, "Exact and Superlative Index Numbers," Journal
of Econometrics,4, 1976, pp. 115-145.
W. E. Diewert (editor), Price Level Measurement (contributions
to economic analysis no. 196), Amsterdam: North-Holland, 1990.
Franklin A. Graybill, Theory and Application of the Linear
Model, Belmont, CA: Wadsworth, 1976.
J. Johnston, Econometric Methods, Third Edition, New York:
McGraw-Hill, 1984.
R. S. Pindyck and J. J. Rotemberg, "The Excess Co-movement of
Commodity Prices," Economic Journal, December 1990, pp. 1173-
1189.
D. S. Prasada Rao and K. S. Banerjee, "A Multilateral Index
Number System Based on the Factorial Approach," Statistical
Papers (Statistische Hefte), 27, 1986, pp. 297-313.
D. S. Prasada Rao, E. Anthony Selvanathan, and Dirk Pilat,
"Generalized Theil-Tornqvist Indices with Applications to
International Comparisons of Prices and Real Output,"
Review of Economics and Statistics, 1995, 352-360.
D. T. Slesnick, "Normative Index Numbers," Journal of
Econometrics, 50 (1991), pp. 107-130.
H. Theil, "Best Linear Index Numbers of Prices and
Quantities," Econometrica, April 1960, pp. 464-480.
H. Theil, "The Information Approach to Demand Analysis,"
Econometrica, January 1965, pp. 67-87.
Gerhard Tintner, Econometrics, New York: Wiley, 1952.
World Bank, Commodity Trade and Price Trends, Baltimore,
MD: Johns Hopkins University Press, 1988.