 .
.
By
Mukhtar M. Ali
Department of Economics
University of Kentucky
Lexington, KY 40506
E-mail: MMALI1@POP.UKY.EDU
Preliminary. Not to be quoted without February, 1996
permission from the author. Revised Oct., 1996
SUMMARY
This paper investigates the finite sample distribution of the
least squares estimator of the autoregressive parameter in a first-order
autoregressive model. Uniform asymptotic expansion for the distribution
applicable to both stationary and nonstationary cases is obtained.
Accuracy of the approximation to the distribution by a first few
terms of this expansion is then investigated. It is found that
the leading term of this expansion approximates well the distribution.
The approximation is, in almost all cases, accurate to the second
decimal place throughout the distribution. In the literature,
there exists a number of approximations to this distribution which
are specifically designed to apply in some special cases of this
model. The present approximation compares favorably with those
approximations and in fact, its accuracy is, with almost no exception,
as good as or better than these other approximations. Convenience
of numerical computations seems also to favor the present approximations
over the others. An application of the finding is illustrated
with examples.
JEL Classification: C13, C22
Key Words: Unit Root; Saddlepoint Approximation; Asymptotic expansion.
Consider the first-order autoregressive model
(1.1) yt = ßyt-1 + et, t = 1, 2, ..., n
where ß is a real constant and the errors et's are identically independently distributed normal variables each with mean = 0 and variance = se2. The initial observation, y0 can be treated as fixed or stochastic. When y0 is stochastic, it is assumed to have a normal distribution with mean 0 and variance se2/(1 - ß2), ½ß½ < 1, and is independent of et's. For ease of exposition, these cases are identified with three models, each corresponding to a different nature of y0. When y0 is fixed at 0, it is named Model A; and Model B when y0 is fixed at a non-zero real constant; and Model C when y0 is N(0, se2/(1 - ß2)) and ½ß½ < 1. When y0 is stochastic, the model is stationary. When y0 is fixed, if ½ß½ < 1, the model is stationary asymptotically. If ½ß½ = 1, this is a well-known random walk model and if ½ß½ > 1, the model is explosive. The random walk model implies unit root hypothesis. Recently, there has been an enormous interest in testing for unit root. They include, among others, Dickey (1976), Dickey and Fuller (1979, 1981), Evans and Savin (1981, 1984), Fuller (1976), Hasza and Fuller (1979), Perron and Phillips (1987), Phillips and Perron (1988), Schwert (1987) and Stock and Watson (1989). Diebold and Nerlove (1990) have given an excellent survey of works in this area.
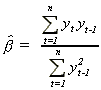
The unknown parameter ß is customarily estimated by its least squares estimator
(1.2) .
Under the assumption that et's
are normally distributed, this is also the maximum likelihood
estimate of ß. The distribution of  has been studied extensively. Unfortunately, the exact distribution
of
has been studied extensively. Unfortunately, the exact distribution
of  , in closed form is unknown. Asymptotically,
it has a normal distribution (Mann and Wald, 1943) if ½ß½
< 1, a Cauchy distribution (White, 1958) if ½ß½
> 1 and a non-standard distribution (White, 1958, Rao, 1978)
if ½ß½
= 1. These asymptotic distributions can be used to approximate
the finite sample distribution of
, in closed form is unknown. Asymptotically,
it has a normal distribution (Mann and Wald, 1943) if ½ß½
< 1, a Cauchy distribution (White, 1958) if ½ß½
> 1 and a non-standard distribution (White, 1958, Rao, 1978)
if ½ß½
= 1. These asymptotic distributions can be used to approximate
the finite sample distribution of  . Such
an approximation results in a nonsmooth transformation from a
normal distribution to a non-standard distribution to a Cauchy
distribution. Because the exact distribution of
. Such
an approximation results in a nonsmooth transformation from a
normal distribution to a non-standard distribution to a Cauchy
distribution. Because the exact distribution of  is continuous for all values of , this suggests that the asymptotic
distribution would not approximate adequately the finite sample
distribution especially near the discontinuity point of = 1.
In fact it has been found that, unless ß is close to zero,
these asymptotic distributions do not approximate well the distribution
in finite samples (Evans and Savin, 1981; Tsui, 1989). The non-standard
limiting distribution when ½ß½
= 1 (Rao, 1978) seems to approximate well the finite sample distribution
when ½ß½
is close to 1, but it is too complicated for practical use. An
accurate approximation to this limiting distribution can, however
be obtained from the asymptotic expansion given by Abadir (1993)
.
is continuous for all values of , this suggests that the asymptotic
distribution would not approximate adequately the finite sample
distribution especially near the discontinuity point of = 1.
In fact it has been found that, unless ß is close to zero,
these asymptotic distributions do not approximate well the distribution
in finite samples (Evans and Savin, 1981; Tsui, 1989). The non-standard
limiting distribution when ½ß½
= 1 (Rao, 1978) seems to approximate well the finite sample distribution
when ½ß½
is close to 1, but it is too complicated for practical use. An
accurate approximation to this limiting distribution can, however
be obtained from the asymptotic expansion given by Abadir (1993)
.
The distribution of  is not known in
closed form but it can be obtained numerically. The exact distribution
has been numerically computed by Phillips (1977, 1978), Evans
and Savin (1981) for selected values of sample size n and the
autoregressive coefficient ß, and comprehensively for a
wide range of (n, ß) by Tsui (1989) and Tsui and Ali (1994).
However, these numerical approaches are often computationally
demanding and expensive even with modern high speed computers.
Besides the numerical methods, several authors (Dickey, 1976;
Fuller, 1976) have performed Monte Carlo experiments to tabulate
the distribution in the case of ß = 1 and y0
= 0 (special case of Model A). These distributions can be used
to test for unit root hypothesis but are not much of use for further
inference about ß.
is not known in
closed form but it can be obtained numerically. The exact distribution
has been numerically computed by Phillips (1977, 1978), Evans
and Savin (1981) for selected values of sample size n and the
autoregressive coefficient ß, and comprehensively for a
wide range of (n, ß) by Tsui (1989) and Tsui and Ali (1994).
However, these numerical approaches are often computationally
demanding and expensive even with modern high speed computers.
Besides the numerical methods, several authors (Dickey, 1976;
Fuller, 1976) have performed Monte Carlo experiments to tabulate
the distribution in the case of ß = 1 and y0
= 0 (special case of Model A). These distributions can be used
to test for unit root hypothesis but are not much of use for further
inference about ß.
As an alternative to numerically computing (or simulating) the
exact distribution, several authors have attempted to obtain convenient
approximations to the distribution of  in finite samples. Phillips (1977, 1978), Satchell (1984), and
Tsui and Ali (1992) have examined approximations by Edgeworth
expansion and found them, except for ß close to 0 and only
at the center of the distribution, to be unsatisfactory. Tsui
and Ali (1992) examined also approximations by Cornish-Fisher-type
(Cornish and Fisher, 1937; Fisher and Cornish, 1960; Hill and
Davis, 1968) expansions and the four-parameter Pearson distributions.
Accuracy of these approximations was found to depend substantially
on sample size and the values of the autoregressive coefficient.
None of these approximations was found to be reliable when the
autoregressive coefficient is moderately large and the sample
size is small. In the case of Model C, Phillips (1978) derived
a saddlepoint approximation to the probability density function.
An approximation to the distribution can be obtained by numerically
integrating this approximate density function. He found this approximation
to be exceptionally accurate, certainly for sample sizes as large
as 30. Unfortunately, the approximation was not defined over a
sizable region of the tail for values of the autoregressive parameter
greater than 0.4. For the same case of Model C, Wang (1992) derived
a saddlepoint approximation to the distribution function which
is available over the entire range of
in finite samples. Phillips (1977, 1978), Satchell (1984), and
Tsui and Ali (1992) have examined approximations by Edgeworth
expansion and found them, except for ß close to 0 and only
at the center of the distribution, to be unsatisfactory. Tsui
and Ali (1992) examined also approximations by Cornish-Fisher-type
(Cornish and Fisher, 1937; Fisher and Cornish, 1960; Hill and
Davis, 1968) expansions and the four-parameter Pearson distributions.
Accuracy of these approximations was found to depend substantially
on sample size and the values of the autoregressive coefficient.
None of these approximations was found to be reliable when the
autoregressive coefficient is moderately large and the sample
size is small. In the case of Model C, Phillips (1978) derived
a saddlepoint approximation to the probability density function.
An approximation to the distribution can be obtained by numerically
integrating this approximate density function. He found this approximation
to be exceptionally accurate, certainly for sample sizes as large
as 30. Unfortunately, the approximation was not defined over a
sizable region of the tail for values of the autoregressive parameter
greater than 0.4. For the same case of Model C, Wang (1992) derived
a saddlepoint approximation to the distribution function which
is available over the entire range of  .
Wang's approximation was found to be exceptionally accurate. Lieberman
(1994) derived an alternative saddlepoint approximation to the
probability density of
.
Wang's approximation was found to be exceptionally accurate. Lieberman
(1994) derived an alternative saddlepoint approximation to the
probability density of  which is also
available over the entire range of
which is also
available over the entire range of  . From
an illustrative check for the accuracy of the distribution function
derived from this approximate density, the approximation was found,
for the Model C, to be excellent for both n = 10 and n = 30 and
for all four ß values of .2, .4, .6 and .8 that were examined.
The approximation seems promising but its accuracy has been tested
for only a few values of n and of ß and for only the model
C. Furthermore, this approximation can be computationally demanding
(even to the point of being impractical), especially for large
sample sizes. This is because a crucial step in the implementation
of the approximation is to obtain a solution of a highly non-linear
equation which requires either a computation of eigenvalues of
an nxn matrix or repeated inversion of nxn matrices. Moreover,
expensive numerical integration may be needed to obtain the distribution
function from the approximate density function.
. From
an illustrative check for the accuracy of the distribution function
derived from this approximate density, the approximation was found,
for the Model C, to be excellent for both n = 10 and n = 30 and
for all four ß values of .2, .4, .6 and .8 that were examined.
The approximation seems promising but its accuracy has been tested
for only a few values of n and of ß and for only the model
C. Furthermore, this approximation can be computationally demanding
(even to the point of being impractical), especially for large
sample sizes. This is because a crucial step in the implementation
of the approximation is to obtain a solution of a highly non-linear
equation which requires either a computation of eigenvalues of
an nxn matrix or repeated inversion of nxn matrices. Moreover,
expensive numerical integration may be needed to obtain the distribution
function from the approximate density function.
Phillips (1988) considered a near-integrated random process where the autoregressive parameter is defined by
(1.3) = exp(c/n).
c is a real constant measuring the deviation from the unit root
case. Cavanagh (1986), Nabeya and Tanaka (1990) and Perron (1989)
examined , in the cases of Model A and Model B, the limiting distribution
of  under (1.3) as an approximation to
the finite sample distribution of
under (1.3) as an approximation to
the finite sample distribution of  . They
claim the approximation to be quite good in the case of Model
A. It is computationally demanding but this limiting distribution
can be computed numerically and it has been tabulated by these
authors. Larsson (1995) has, however provided a convenient approximation
to this limiting distribution in the case of Model A. This approximation
may serve as an approximation to the finite sample distribution
of
. They
claim the approximation to be quite good in the case of Model
A. It is computationally demanding but this limiting distribution
can be computed numerically and it has been tabulated by these
authors. Larsson (1995) has, however provided a convenient approximation
to this limiting distribution in the case of Model A. This approximation
may serve as an approximation to the finite sample distribution
of  . In search of further approximation
to the distribution of
. In search of further approximation
to the distribution of  , Perron (1991a,
b) considered the continuous time Ornstein-Uhlenbeck process dyt
= ytdt + dwt, where wt is a Wiener
process. Let
, Perron (1991a,
b) considered the continuous time Ornstein-Uhlenbeck process dyt
= ytdt + dwt, where wt is a Wiener
process. Let  be the continuous time
maximum likelihood (conditional upon y0) estimator
of based upon a single path of data of length T. He then advanced
the exact distribution of
be the continuous time
maximum likelihood (conditional upon y0) estimator
of based upon a single path of data of length T. He then advanced
the exact distribution of  as an approximation
to the finite sample distribution of
as an approximation
to the finite sample distribution of  .
Again, it is computationally demanding but the distribution of
.
Again, it is computationally demanding but the distribution of
 can be computed numerically. Perron (1991a,
b) have provided some selected percentage points of this distribution.
can be computed numerically. Perron (1991a,
b) have provided some selected percentage points of this distribution.
In summary, it seems, with all the shortcomings, only viable approximations available in the literature are those by Phillips (1978), Perron (1991a), Wang (1992) and Lieberman (1994) in the case of Model C, those by Perron (1991b), Lieberman (1994) and Larsson (1995) in the case of Model A and that by Perron (1991b) in the case of Model B.
In this paper, an uniform asymptotic expansion for the distribution
(not the density function) of the least squares estimator of ß
is obtained. This expansion is applicable for all the three models,
Model A, Model B and Model C. An alternative expression of the
joint characteristic function of the numerator and denominator
of  as a product in trigonometric functions
avoids the costly computation of eigenvalues or repeated inversion
of high order matrices that requires in implementing Lieberman
(1994) approximation. Accuracy of approximation to the distribution
by a first few terms of this expansion is investigated for a wide
range of values of n and of ß and for all the three models.
It is found that the very first term of this expansion approximates
well the distribution, especially at the extreme tails. The approximation
is, in almost all cases, accurate to the second decimal place
throughout the distribution. The accuracy improves by including
further term beyond the first term of this expansion in the approximation.
But occasionally the accuracy of such an approximation with additional
term(s) deteriorates and sometimes it deteriorates to the point
of being useless giving probability value which is outside the
range of (0, 1). The first-term approximation compares favorably
with the approximations given by Phillips (1978), Wang (1992)
and Lieberman (1994) in the case of Model C, is as good as and
in general, better than the approximations given by Larsson (1995)
in the case of Model A , Perron (1991b) in the case of Model A
and Model B and Perron(1991a) in the case of Model C.
as a product in trigonometric functions
avoids the costly computation of eigenvalues or repeated inversion
of high order matrices that requires in implementing Lieberman
(1994) approximation. Accuracy of approximation to the distribution
by a first few terms of this expansion is investigated for a wide
range of values of n and of ß and for all the three models.
It is found that the very first term of this expansion approximates
well the distribution, especially at the extreme tails. The approximation
is, in almost all cases, accurate to the second decimal place
throughout the distribution. The accuracy improves by including
further term beyond the first term of this expansion in the approximation.
But occasionally the accuracy of such an approximation with additional
term(s) deteriorates and sometimes it deteriorates to the point
of being useless giving probability value which is outside the
range of (0, 1). The first-term approximation compares favorably
with the approximations given by Phillips (1978), Wang (1992)
and Lieberman (1994) in the case of Model C, is as good as and
in general, better than the approximations given by Larsson (1995)
in the case of Model A , Perron (1991b) in the case of Model A
and Model B and Perron(1991a) in the case of Model C.
The plan of this study is as follows. The uniform asymptotic
expansion for the distribution of  is
obtained in section 2. The accuracy of the expansion to the distribution
is examined in section 3. Accuracy of the first-term approximation
is then compared with those given by Phillips (1978), Perron (1991a),
Wang(1992) and Lieberman (1994) in the case of Model C; Perron
(1991b), Lieberman (1994) and Larsson (1995) in the case of Model
A; and Perron(1991b) in the case of Model B. These comparisons
are also reported in section 3. Examples illustrating the use
of the results of this paper are reported in section 4. Some concluding
remarks are given in section 5.
is
obtained in section 2. The accuracy of the expansion to the distribution
is examined in section 3. Accuracy of the first-term approximation
is then compared with those given by Phillips (1978), Perron (1991a),
Wang(1992) and Lieberman (1994) in the case of Model C; Perron
(1991b), Lieberman (1994) and Larsson (1995) in the case of Model
A; and Perron(1991b) in the case of Model B. These comparisons
are also reported in section 3. Examples illustrating the use
of the results of this paper are reported in section 4. Some concluding
remarks are given in section 5.
2. ASYMPTOTIC EXPANSION
There seems to have been some confusion in the literature in regards to the sample size n. Following Hurwicz (1950), the sample size is taken as the number of stochastic yt in (1.1). Thus, the sample size is n in Models A and B where y0 is fixed and it is (n+1) in Model C where y0 is stochastic. Defining
(2.1) P =  and Q =
  ,
,
the least squares estimator for all the three models (A, B and
C) is  = P/Q.
Let y(iu, iv) = E(eiuP+ivQ)
be the joint characteristic function of P and Q. Then, by Theorem
1 of Gurland (1948, p. 229), the cumulative distribution function
of  is given as
(2.2) G(w) = Pr( < w) = Pr(P/Q <
w)
< w) = Pr(P/Q <
w)
= 
A change of variable (new u = old ui) in (2.2) leads to
(2.3) G(w) = 
where L is a path of integration made up of two segments: from -¥i to -di, and from di to ¥i. It can be shown that the integrand has a simple pole at u = 0 and y(0, 0) = 1, so that, by Cauchy's integral formula,
(2.4) 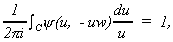
where C is any closed curve encircling no singularity other than u = 0, in the positive (counterclockwise) direction. Suppose that the curve C is a circle of radius d, then we can rewrite (2.3) as
(2.5) G(w) = 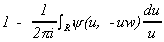 ,
,
where the new path of integration R is obtained by adding that half of the circle C for which Re(u) > 0 to the original path L. It can be shown that the integrand is analytic for Re(u) > 0. Thus, by the well known theorem of Cauchy, the path of integration R can be modified to obtain
(2.6) G(w) =  , c > 0.
It can be seen that the integrand in (2.6) has a simple pole at u = 0 and following Lieberman (1994), it can be shown that the integrand has only one saddlepoint. Defining, h(u) = -(1/n)lny(u, -uw), the integral in (2.6) is, then exactly in the form of that in equation (65) in Rice (1968). Hence, from equation (68) of Rice (1968), the uniform asymptotic expansion for G(w) is given by
(2.7) G(w) = 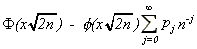 ,
,
where F(.) and f(.) are, respectively the distribution and probability density function of a standard normal variable,
pj =  , j ³
0,
, j ³
0,
u1 is the saddlepoint, h(0) = 0, h(r)(u)
=  , r ³
0, h(0) = h, h1(r) = h(r)(u1),
h1 = h(u1), h(1)(u1)
= 0,
, r ³
0, h(0) = h, h1(r) = h(r)(u1),
h1 = h(u1), h(1)(u1)
= 0,
x = (-h1)(1/2)u1/½u1½, z = u1(h1(2)/2)(1/2), (q)0 = 1, (q)j = q(q + 1) ... (q + j - 1), b00 =1, b0i = 0, for i ³ 1, and
bk+1,i+1 =  ,
,
ds = -2h1(s+2)/[(s+2)!h1(2)], s ³ 1.
In deriving the expansion in (2.7), it is assumed that the origin, at which there is a simple pole for the integrand in (2.6), does not coincide with the saddlepoint. If the saddlepoint is at the origin, a classical saddlepoint analysis (Lugannani and Rice, 1980, p. 479) can be applied to obtain an asymptotic expansion for G(w) as
(2.8) 
where qi = h(i)(0)/(i), i = 3, 4, ....
3. ACCURACY OF THE EXPANSION
The distribution can be computed numerically from (2.7) (or (2.8)). A major problem is the evaluation of y(u, -uw) and hence of the function h(u) that appears in the integrand in (2.6). Lieberman (1994) obtained y(u, -uw) as a determinant of an nxn matrix depending on w. He also expressed it as an elementary function of eigenvalues of the same nxn matrix. For either case, as it requires determinant or eigenvalues of an nxn matrix for each w, the computation becomes prohibitively time consuming as the sample size n becomes large, say larger than 200. From White (1958), an expression for y(u, -uw) can be derived in closed form. It, however involves in raising some (real) expressions to the power of sample size n. Thus, for large sample sizes, it becomes problematic to maintain reasonable numerical accuracy. Alternatively, following White (1961), y(u, -uw) can be expressed as a polynomial of degree n, the sample size. Unfortunately, this creates computational problems in large sample sizes because this polynomial of high degree often contains a large number of terms each of which is negligible individually but significant collectively. The expression for y(u, -uw) that is found to be most convenient is the one obtained by Tsui (1989) and Tsui and Ali (1994). This expression is in trigonometric functions and is given as
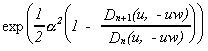
(3.1) y(u, -uw) = Dn(u, -uw)-1/2, for Model A
=  Dn(u, -uw)-1/2,
for Model B
Dn(u, -uw)-1/2,
for Model B
= Ö(1 - ß2)[Dn+1(u, -uw) - ß2Dn(u, -uw)]-1/2, for Model C
where a = y0/se,
(3.2) Dn(u, -uw) = Sn-1(u, -uw) - (ß + u)2Sn-2(u, -uw), and
(3.3) Sn(u, -uw) =  .
.
Using expression (3.1), it is a routine matter to compute h(u) and its various derivatives that are required to obtain the distribution function from (2.7) (or, (2.8)). In this computations, the basic function to evaluate is Sn(u, -uw) and its derivatives. As Sn(u, -uw) = Sgn[Sn(u, -uw)]½Sn(u, -uw)½, where Sgn(x) = 1, if x ³ 0 and = -1, if x < 0, the function Sn(u, -uw) and its derivatives can be obtained from those of ½Sn(u, -uw)½ and its derivatives. In turn, the function ½Sn(u, -uw)½ and its derivatives may be evaluated utilizing the relation
(3.3) ln½Sn(u, v)½
=  .
.
It may be noted that the saddlepoint u1 is a solution to the equation
(3.4) h(1)(u1) = 0.
The equation (3.4) can be solved by the iterative Newton-Raphson method starting at u1 = 0 and modifying, if necessary the step size at each iteration so that y(u, -uw) is positive.
The expansion (2.7) (or, (2.8)) can be used to compute the distribution
function, G(w). Unfortunately, most asymptotic expansions are
nonconvergent, with the magnitude of successive terms tracking
a J curve of initial decline followed by a steep rise. Fortunately,
often a few of the beginning terms provide adequate approximation.
To check for the accuracy of the approximation to the distribution
of  by a few terms in the expansion (2.7)
(or, (2.8)), we consider three approximations, LEAD, LEAD2 and
LEAD3 which are obtained by truncating the expansion (2.7) (or
(2.8)) at the leading term, the second term and the third term,
respectively. More specifically,
by a few terms in the expansion (2.7)
(or, (2.8)), we consider three approximations, LEAD, LEAD2 and
LEAD3 which are obtained by truncating the expansion (2.7) (or
(2.8)) at the leading term, the second term and the third term,
respectively. More specifically,
(3.5) LEAD: expansion (2.7) truncated at j = 0 (or, expansion (2.8) truncated to the terms at most of order O(n-1/2))
(3.6) LEAD2: expansion (2.7) truncated at j = 1 (or, expansion (2.8) truncated to the terms at most of order O(n-3/2))
(3.7) LEAD3: expansion (2.7) truncated at j = 2 (or, expansion (2.8) truncated to the terms at most of order O(n-5/2))
To check for the accuracy of these approximations, the exact
distributions obtained by evaluating numerically the integral
in (2.2) (see Tsui (1989) and Tsui and Ali (1994)) are compared
with these approximations. A fortran program is written to implement
these approximations and can be obtained on request. For a thorough
investigation, the distributions and the approximations were computed
comprehensively for Models A, B and C. In all cases, we take various
sample size n = 10, 20, 30, 40, 50, 75, 100, 150, 200, 250, 300
and 500. For Models A and B, choices of autoregressive coefficient,
ß include 0.4, 0.6, 0.8, 0.9, 0.95, 0.99, 1.0, 1.01. For
Model B, the values of the parameter a
are: 1 and 4. As for Model C, choices of autoregressive coefficient,
ß are: 0.4, 0.6, 0.8, 0.9, 0.95, 0.975, 0.99. In each case,
the distribution G(w) is computed at 33 percentile points, w =
x/g(n) + ß (x = -16.0, -12.0, -8.0, -6.0, -4.0, -3.5, -3.0,
-2.8, -2.6, -2.4, -2.2, -2.0, -1.8, -1.6, -1.4, -1.2, -1.0, -0.8,
-0.6, -0.4, -0.2, 0.0, 0.2, 0.4, 0.6, 0.8, 1.0, 1.2, 1.4, 1.6,
1.8, 2.0 and 4.0) where g(n) =  , if ½ß½
< 1, =
, if ½ß½
< 1, =  , if ½ß½
= 1.0 and =
, if ½ß½
= 1.0 and =  , if ½ß½
> 1. It may be worth observing that in this experimentation,
we have taken only positive values of ß. This is because
the distribution of
, if ½ß½
> 1. It may be worth observing that in this experimentation,
we have taken only positive values of ß. This is because
the distribution of  for a given ß
is the mirror-image of that for - ß (see Cryer, Nankervis
and Savin, 1989). To save space, Tables 1, 2 and 3 reproduce some
selected but representative results for Models A, B and C, respectively.
All the exact and approximate distributions that are computed
can be obtained upon request.
for a given ß
is the mirror-image of that for - ß (see Cryer, Nankervis
and Savin, 1989). To save space, Tables 1, 2 and 3 reproduce some
selected but representative results for Models A, B and C, respectively.
All the exact and approximate distributions that are computed
can be obtained upon request.
Comparing the approximations with the exact, some definite conclusions
can be drawn. In particular, it is found that, for all cases considered,
LEAD approximates exceptionally well, especially at the tails
of the distributions where most of the inferential interests lie.
For example, for sample size as small as 10, the LEAD approximations
of 0.0223, 0.0177 and 0.0357 to Pr(g(n)( - ) < x) for x = -6.0 and = 1.0 in Model A, for x = -6.0,
= 1.0 and = 1 in Model B and x = -6.0, = 0.95 in Model C ,
respectively match quite closely to the corresponding exact values
of 0.0208, 0.0165 and 0.0331 (see Tables 1, 2 and 3). As can be
seen from the entries in Tables 1, 2, and 3, LEAD approximation
matches, in almost all the cases to the second decimal place and
quite often to the third decimal place to the corresponding exact
value. Almost without exception, the LEAD approximates exceptionally
well at the tails of the distribution (where most of the inferential
interests lie) matching the exact value at the third decimal place.
Quite often LEAD2 or LEAD3 provides more accurate approximation
than that given by LEAD. Thus, for example, while the exact
value of Pr(g(n)(
- ) < x) for x = -6.0 and = 1.0 in Model A, for x = -6.0,
= 1.0 and = 1 in Model B and x = -6.0, = 0.95 in Model C ,
respectively match quite closely to the corresponding exact values
of 0.0208, 0.0165 and 0.0331 (see Tables 1, 2 and 3). As can be
seen from the entries in Tables 1, 2, and 3, LEAD approximation
matches, in almost all the cases to the second decimal place and
quite often to the third decimal place to the corresponding exact
value. Almost without exception, the LEAD approximates exceptionally
well at the tails of the distribution (where most of the inferential
interests lie) matching the exact value at the third decimal place.
Quite often LEAD2 or LEAD3 provides more accurate approximation
than that given by LEAD. Thus, for example, while the exact
value of Pr(g(n)( - ) < x) for n =
10, x = -6.0, = 1.0 in Model A is 0.0208, the approximate values
from LEAD, LEAD2 and LEAD3 are, respectively 0.0223, 0.0203 and
0.0211 (see Table 1). Unfortunately, in a number of cases the
accuracy of LEAD2 and LEAD3 deteriorates to the point of being
useless giving probability outside the range of (0, 1). For example,
LEAD approximation of 0.6428 to Pr(g(n)(
- ) < x) for n =
10, x = -6.0, = 1.0 in Model A is 0.0208, the approximate values
from LEAD, LEAD2 and LEAD3 are, respectively 0.0223, 0.0203 and
0.0211 (see Table 1). Unfortunately, in a number of cases the
accuracy of LEAD2 and LEAD3 deteriorates to the point of being
useless giving probability outside the range of (0, 1). For example,
LEAD approximation of 0.6428 to Pr(g(n)( - ) < x) for x = -0.4, = 1.01, n = 10 in Model A (see Table
1) matches well the exact value of 0.6396 but both approximations
LEAD2 and LEAD3 provide values which are outside the range of
(0, 1).
- ) < x) for x = -0.4, = 1.01, n = 10 in Model A (see Table
1) matches well the exact value of 0.6396 but both approximations
LEAD2 and LEAD3 provide values which are outside the range of
(0, 1).
Preceding analysis suggests that, for all practical purposes,
LEAD provides excellent approximation to Pr(g(n)( - ) < x) for all three Models A, B and C. To shed further light
on its accuracy, in what follows we compare its accuracy with
several other approximations that are available in the literature,
namely the approximations by Perron (1991b), Lieberman (1994)
and Larsson (1995) in the case of Model A; Perron (1991b) in
the case of Model B; and Phillips (1978), Perron (1991a), Wang
(1992) and Lieberman (1994) in the case of Model C.
- ) < x) for all three Models A, B and C. To shed further light
on its accuracy, in what follows we compare its accuracy with
several other approximations that are available in the literature,
namely the approximations by Perron (1991b), Lieberman (1994)
and Larsson (1995) in the case of Model A; Perron (1991b) in
the case of Model B; and Phillips (1978), Perron (1991a), Wang
(1992) and Lieberman (1994) in the case of Model C.
In the case of Model A, Perron (1991b) provides an approximation
to the distribution of the least squares estimator  and
tabulates a selected set of percentage points as approximations
to the percentage points of the distribution of
and
tabulates a selected set of percentage points as approximations
to the percentage points of the distribution of  .
These percentage points were tabulated for a number of parameter
values of c where = exp(c/n). At these percentage points, we
evaluate the Lieberman (1994), Larsson (1995) and our LEAD approximations
to the the distribution function for
.
These percentage points were tabulated for a number of parameter
values of c where = exp(c/n). At these percentage points, we
evaluate the Lieberman (1994), Larsson (1995) and our LEAD approximations
to the the distribution function for  .
We also obtain "exact" evaluation of the distribution
function at these percentage points by simulation with one-half
of one million replications. A selected but representative set
of these evaluations of the distribution function is reported
in Table 4. Lieberman (1994) approximation matches the LEAD to
the fourth decimal place throughout our comparison and hence it
is not shown in this table. It can be seen from the entries in
this table that Larsson (1995) approximation is not available
for a part of the region of the distribution function but whenever
it is available it provides an accurate approximation to the Perron
(1991b) approximation; and that LEAD approximates well and matches
the distribution function, almost always to the second decimal
place. Accuracy of Perron (1991b) or Larsson (1995) approximation
is rather disappointing. For example, for the case when c = -5.0
(see Panel A in the table), at the percentage point of -10.4633,
while the exact evaluation of the distribution function, at n
= 10, = 0.6065 is 0.0039, Perron and Larsson approximations are
, respectively 0.050 and 0.0580. The accuracy of both Perron and
Larsson approximations improves as the sample size and/or is
increased. Thus, in the above example, at n = 50, = 0.9048, the
exact evaluation of the distribution function is 0.0358 which
is closer to the Perron and Larsson approximations of 0.050 and
0.0580 than it was when n = 10, = 0.6065. Even then, for a sample
of size as large as 50, the accuracy of both Perron and Larsson
approximations is questionable. However, it may be of some comfort
to know that both Perron and Larsson provide more accurate approximation
to the distribution at the right tail than at the left tail and
both approximations are reasonably accurate when and/or n are
sufficiently large. Thus, in the case of c = 2.0, n = 50 and
= 1.041, at the percentage point of 0.7585, the exact evaluation
of the distribution function of 0.9425 is reasonably close to
the Perron approximation of 0.95 and also to the Larsson approximation
of 0.9332.
.
We also obtain "exact" evaluation of the distribution
function at these percentage points by simulation with one-half
of one million replications. A selected but representative set
of these evaluations of the distribution function is reported
in Table 4. Lieberman (1994) approximation matches the LEAD to
the fourth decimal place throughout our comparison and hence it
is not shown in this table. It can be seen from the entries in
this table that Larsson (1995) approximation is not available
for a part of the region of the distribution function but whenever
it is available it provides an accurate approximation to the Perron
(1991b) approximation; and that LEAD approximates well and matches
the distribution function, almost always to the second decimal
place. Accuracy of Perron (1991b) or Larsson (1995) approximation
is rather disappointing. For example, for the case when c = -5.0
(see Panel A in the table), at the percentage point of -10.4633,
while the exact evaluation of the distribution function, at n
= 10, = 0.6065 is 0.0039, Perron and Larsson approximations are
, respectively 0.050 and 0.0580. The accuracy of both Perron and
Larsson approximations improves as the sample size and/or is
increased. Thus, in the above example, at n = 50, = 0.9048, the
exact evaluation of the distribution function is 0.0358 which
is closer to the Perron and Larsson approximations of 0.050 and
0.0580 than it was when n = 10, = 0.6065. Even then, for a sample
of size as large as 50, the accuracy of both Perron and Larsson
approximations is questionable. However, it may be of some comfort
to know that both Perron and Larsson provide more accurate approximation
to the distribution at the right tail than at the left tail and
both approximations are reasonably accurate when and/or n are
sufficiently large. Thus, in the case of c = 2.0, n = 50 and
= 1.041, at the percentage point of 0.7585, the exact evaluation
of the distribution function of 0.9425 is reasonably close to
the Perron approximation of 0.95 and also to the Larsson approximation
of 0.9332.
In the case of Model B, Perron (1991b) provides an approximation
to the distribution of the least squares estimator  and
tabulates a selected set of percentage points as approximations
to the percentage points of the distribution of
and
tabulates a selected set of percentage points as approximations
to the percentage points of the distribution of  .
These percentage points were tabulated for a number of parameter
values of c and where = exp(c/n) and = n1/2. At
these percentage points, we evaluate our LEAD approximation to
the distribution function for
.
These percentage points were tabulated for a number of parameter
values of c and where = exp(c/n) and = n1/2. At
these percentage points, we evaluate our LEAD approximation to
the distribution function for  . We also
obtain "exact" evaluation of the distribution function
at these percentage points by simulation with one-half of one
million replications. A selected but representative set of these
evaluations of the distribution function is reported in Table
5. Examining the entries, it is clear that, at every percentage
point, the LEAD approximation outperforms the Perron approximation.
While the LEAD approximation matches the exact evaluation, almost
always to the third decimal place and often to the fourth decimal
place, the Perron approximation fails often to match even to the
second decimal place. Accuracy of the Perron approximation improves
as the sample size is increased but it has a questionable accuracy
even for a sample of size as large as 50. For example, for c =
-5.0, = 0.5, n = 50, = 0.9048, = 3.54, at the percentage point
of -8.7550, while (see Table 5, Panel A) the exact evaluation
of the distribution is 0.0369, the Perron approximation is 0.050.
. We also
obtain "exact" evaluation of the distribution function
at these percentage points by simulation with one-half of one
million replications. A selected but representative set of these
evaluations of the distribution function is reported in Table
5. Examining the entries, it is clear that, at every percentage
point, the LEAD approximation outperforms the Perron approximation.
While the LEAD approximation matches the exact evaluation, almost
always to the third decimal place and often to the fourth decimal
place, the Perron approximation fails often to match even to the
second decimal place. Accuracy of the Perron approximation improves
as the sample size is increased but it has a questionable accuracy
even for a sample of size as large as 50. For example, for c =
-5.0, = 0.5, n = 50, = 0.9048, = 3.54, at the percentage point
of -8.7550, while (see Table 5, Panel A) the exact evaluation
of the distribution is 0.0369, the Perron approximation is 0.050.
In the case of Model C, Perron (1991a) provides an approximation
to the distribution of the least squares estimator  and
tabulates a selected set of percentage points as approximations
to the percentage points of the distribution of
and
tabulates a selected set of percentage points as approximations
to the percentage points of the distribution of  .
These percentage points were tabulated for a number of parameter
values of c where = exp(c/n). At these percentage points, we
evaluate our LEAD approximation to the distribution function for
.
These percentage points were tabulated for a number of parameter
values of c where = exp(c/n). At these percentage points, we
evaluate our LEAD approximation to the distribution function for
 . We also obtain "exact" evaluation
of the distribution function at these percentage points by simulation
with one-half of one million replications. A selected but representative
set of these evaluations of the distribution function is reported
in Table 6. Examining the entries, it is clear that, at every
percentage point, the LEAD approximation outperforms the Perron
approximation. As in the case of Model B, while the LEAD approximation
matches the exact evaluation, almost always to the third decimal
place and often to the fourth decimal place, the Perron approximation
fails often to match even to the second decimal place except at
the right tail of the distribution. Accuracy of the Perron approximation
improves as the sample size is increased but it has a questionable
accuracy even for a sample of size as large as 50. For example,
for c = -10.0, n = 50, = 0.8187, at the percentage point of -11.834,
while (see Table 6, Panel A) the exact evaluation of the distribution
is 0.0278, the Perron approximation is 0.050.
. We also obtain "exact" evaluation
of the distribution function at these percentage points by simulation
with one-half of one million replications. A selected but representative
set of these evaluations of the distribution function is reported
in Table 6. Examining the entries, it is clear that, at every
percentage point, the LEAD approximation outperforms the Perron
approximation. As in the case of Model B, while the LEAD approximation
matches the exact evaluation, almost always to the third decimal
place and often to the fourth decimal place, the Perron approximation
fails often to match even to the second decimal place except at
the right tail of the distribution. Accuracy of the Perron approximation
improves as the sample size is increased but it has a questionable
accuracy even for a sample of size as large as 50. For example,
for c = -10.0, n = 50, = 0.8187, at the percentage point of -11.834,
while (see Table 6, Panel A) the exact evaluation of the distribution
is 0.0278, the Perron approximation is 0.050.
There are several other approximations in the case of Model C.
Phillips (1978), Wang (1992) and Lieberman (1994) have provided
approximations to the Pr . For a number
of sample sizes of n , a variety of values of , and at a number
of percentage points, x, Phillips (1978) tabulates his approximation
(wherever it is available) to this probability along with its
exact value. We evaluate our LEAD approximation for each of these
combinations of n, and x. A selected but representative set of
these evaluations is reported in Table 7. Lieberman (1994) approximation
matches the LEAD to the fourth decimal place throughout our comparison
and hence it is not shown in the table. Note, however that the
approximations reported by Lieberman (1994, Table 1) do not match
the corresponding LEAD approximations but they match the LEAD
approximations to the left-tailed probability, namely the Pr
. For a number
of sample sizes of n , a variety of values of , and at a number
of percentage points, x, Phillips (1978) tabulates his approximation
(wherever it is available) to this probability along with its
exact value. We evaluate our LEAD approximation for each of these
combinations of n, and x. A selected but representative set of
these evaluations is reported in Table 7. Lieberman (1994) approximation
matches the LEAD to the fourth decimal place throughout our comparison
and hence it is not shown in the table. Note, however that the
approximations reported by Lieberman (1994, Table 1) do not match
the corresponding LEAD approximations but they match the LEAD
approximations to the left-tailed probability, namely the Pr .
It is clear from the entries in Table 7 that all four approximations,
Phillips (1978, whenever it is available), Wang (1992), Lieberman
(1994) and the LEAD are highly accurate and they are all of comparable
accuaracy.
.
It is clear from the entries in Table 7 that all four approximations,
Phillips (1978, whenever it is available), Wang (1992), Lieberman
(1994) and the LEAD are highly accurate and they are all of comparable
accuaracy.
Preceding analysis suggests that, for all practical purposes,
the distribution of the least squares estimator  ,
G(w) = Pr(
,
G(w) = Pr( < w) can be well approximated
by the first term in the expansion (2.7) (or, (2.8)), specifically
by
< w) can be well approximated
by the first term in the expansion (2.7) (or, (2.8)), specifically
by
(4.1) AG(w) = F( )
- f(
)
- f( )(
)( ),
if the saddlepoint u1 ¹
0
),
if the saddlepoint u1 ¹
0
= 0.5 + (2pn)-½q3, if the saddlepoint u1 = 0
where u1 is the saddlepoint satisfying h(1)(u) = 0, h(u) is as defined preceding the equation (2.7), h1 = h(u1), x = (-h1)(1/2)u1/½u1½, z = u1(h1(2)/2)(1/2), and q3 = h(3)(0)/(6[h(2)(0)](3/2)). The approximation is applicable for all the Models A, B and C and for all possible values of the parameter ß (½ß½ < 1, ½ß½ = 1, or ½ß½ > 1).
The approximation AG(w) can then be used to make inference about the parameter ß. In most applications, it is of interest to know whether ½ß½ < 1, or, ½ß½ = 1, or ½ß½ > 1. Such inference can be made from an appropriate confidence interval estimate for ß. These confidence interval estimates can be obtained using the approximation AG(w). It can be shown that the lower and upper limit of the central 100(1 - g)% confidence interval are, respectively the solutions of
(4.2) AG( ) = 1 - g/2,
and
) = 1 - g/2,
and
(4.3) AG( ) = g/2
where  is the least squares estimate of
ß. These equations can be solved by any of a variety of
successive approximation methods (see Abramowitz and Stegun, 1970,
p. 18). A fortran program which can be obtained on request is
written to solve these equations using the Newton's Rule. To start
the approximation method, both the lower and upper limit can be
taken to be the estimate
is the least squares estimate of
ß. These equations can be solved by any of a variety of
successive approximation methods (see Abramowitz and Stegun, 1970,
p. 18). A fortran program which can be obtained on request is
written to solve these equations using the Newton's Rule. To start
the approximation method, both the lower and upper limit can be
taken to be the estimate  .
.
Confidence interval is a convenient tool to make inference. However,
if there is a specific inference needs to be made, it may be more
convenient to make such inference by testing specific hypothesis.
Thus, if one is interested to know whether there is a root = 1
in the autoregressive polynomial or not, one may test the hypothesis
H0: ß = 1, against the alternatives Ha:
ß < 1. We would reject H0 if the p-value given
by Pr( < sample
  ½ ß = 1) is smaller than
the level of significance. Using our approximation AG(w) to the
distribution of
½ ß = 1) is smaller than
the level of significance. Using our approximation AG(w) to the
distribution of  , this p-value can be
computed.
, this p-value can be
computed.
To illustrate the use of these results, we have analyzed three
sets of data generated from the Model A. In each case, we have
chosen n = 25 and se = 1.
The first data set is generated from the model with ß =
.95 (asymptotically stationary model), the second with ß
= 1 (random-walk model) and the third with ß = 1.05 (explosive
model). The three data sets, estimate  based on these data and the central 95% confidence interval estimates
are found as follows.
based on these data and the central 95% confidence interval estimates
are found as follows.
Data Set 1: 0.86, 1.26, 2.39, 2.60, 2.81, 4.15, 3.36, 1.25, 1.17, 0.16, -0.09, 0.54, -0.57
-2.62, -3.10, -1.30, 0.19, 1.56, 1.60, 1.49, 3.62, 3.96, 3.03, 2.49, 3.64
 = 0.930; 95% confidence interval: [0.772,
1.186]
= 0.930; 95% confidence interval: [0.772,
1.186]
The p-value, in testing H0: ß = 1 against Ha: ß < 1, is 0.371
Data Set 2: 0.86, 1.31, 2.50, 2.82, 3.16, 4.64, 4.06, 2.12, 2.11, 1.15, 0.91, 1.54, 0.45,
-1.62, -2.23, -0.59, 0.83, 2.21, 2.33, 2.30, 4.51, 5.03, 4.29, 3.91, 5.18
 = 0.991; 95% confidence interval: [0.874,
1.204]
= 0.991; 95% confidence interval: [0.874,
1.204]
The p-value, in testing H0: ß = 1 against Ha: ß < 1, is 0.626
Data Set 3: 0.86, 1.35, 2.61, 3.06, 3.56, 5.22, 4.89, 3.20, 3.34, 2.56, 2.44, 3.19, 2.27
0.31, -0.29, 1.33, 2.83, 4.35, 4.68, 4.89, 7.34, 8.23, 7.91, 7.91, 9.58
 = 1.066; 95% confidence interval: [0.989,
1.222]
= 1.066; 95% confidence interval: [0.989,
1.222]
The p-value, in testing H0: ß = 1 against Ha: ß < 1, is 0.965
Based on these confidence intervals and p-values, one would not reject the hypothesis of unit root in all these three cases. However, for data set 2, unit root is located near to the center of this interval; for data set 1, it is close to the upper limit of the interval and for data set 3, it is close to the lower limit of the interval. This evidence may be interpreted to mean that the model generating the data set 1 is likely to have root (the parameter ß) less than 1, that generating the data set 2 is likely to have unit root and that generating the data set 3 to have root larger than 1.
5. CONCLUDING REMARKS
Autoregressive models have been found to be most prominent among models in describing time movement of a time series variable. Inference on the parameters of these models are then of utmost interest to the practitioners. Often, such inference has been based on the least squares estimators. As the exact distributions of these least squares estimators are rarely known, the practitioners have been forced to rely on the known asymptotic distributions for inferential purposes. There are at least two disadvantages to such procedures. First, the asymptotic distributions are either too complicated for practical use or provide impractical poor approximations to exact distributions, especially for sample sizes that are usually available in practice. Second, the form of the asymptotic distributions depend upon the parameter values. More specifically, asymptotic distribution that is appropriate when all the roots of the autoregressive polynomial are less than 1 in magnitude is different from the one that is appropriate if at least one of the roots is equal to 1, and these asymptotic distributions are, in turn different from the one appropriate when some of the roots are greater than 1 in magnitudes. This nonsmooth transformation of the asymptotic distribution from the case when the roots are less than 1 to the case when some roots are equal to 1 to the case when some roots are greater than 1 is, to say the least counterintuitive and it makes it essential prerequisite to have the knowledge of any root of the autoregressive polynomial to be equal to 1 or greater than 1 before one can use the appropriate asymptotic distribution for inference.
This paper considers the autoregressive model of order one. An uniform asymptotic expansion for the distribution of the least squares estimator for the autoregressive coefficient is derived. This is a valid expansion irrespective of the size of the root of the autoregressive polynomial. Unfortunately, this asymptotic expansion is, like most asymptotic expansions nonconvergent. Fortunately, however, it is found, after a detailed investigation that the leading term of the expansion provides excellent approximation to the exact distribution. Thus, this approximation can be used, for all practical purposes to make inference. To implement this approximation, one is required to evaluate a certain characteristic function and its first two derivatives. A convenient closed-form expression for the characteristic function is given which should facilitate such computations.
There are a number of alternative approximations to the distribution of the least squares estimator. Of these approximations, the most promising ones seem to be those given by Perron (1991b), Lieberman (1994) and Larsson (1995) in the case of Model A; Perron (1991b) in the case of Model B; and Phillips (1978), Perron (1991a), Wang (1992) and Lieberman (1994) in the case of Model C. A thorough comparison of accuracy of these approximations with that of our approximation (LEAD), we find that the LEAD is exceptionally accurate, and its accuracy is far superior to those given by Perron (1991b) and Larsson (1995) in the case of Model A, Perron (1991b) in the case of Model B, and Perron (1991a) in the case of Model C; and is as accurate or better than those given by Lieberman (1994) in the case of Model A and Phillips (1978), Wang (1992) and Lieberman (1994) in the case of Model C. In short, in the case of Model B, approximation from Perron (1991b) has questionable accuracy and there is no rival to the LEAD approximation. In the case of Model A, approximations from Perron (1991b) and Larsson (1995) have questionable accuracy, and both the LEAD and the approximation from Lieberman (1994) provide excellent accuracy. Thus, in this case of Model A, there are two excellent approximations. However, on the ground of computational convenience, the LEAD is preferable to that given by Lieberman (1994), especially if the sample size is large. Finally, in the case of Model C, approximation from Perron (1991a) provide questionable accuracy but the LEAD and the remaining three approximations from Phillips (1978), Wang (1992) and Lieberman (1994) provide excellent accuracy. Of the four viable alternative approximations, the approximation from Phillips (1978) is not available for a sizable region in the tail of the distribution where most of the inferential interest lie; the computational burden to implement the approximation from Lieberman (1994) can be prohibitive, especially if the sample size is large; and computationally, the approximation from Wang (1992) is as convenient as the LEAD. Thus, in the case of Model C, the LEAD and the approximation from Wang (1992) are preferable to all the others and there is not much reason to prefer Wang (1992) to the LEAD . In summary, the LEAD provides the most desirable approximation in all the cases of Model A, Model B and Model C and only in the case of Model C, the approximation from Wang (1992) can be as desirable as the LEAD.
 - ) < x)
x ß = 1.0 ß = 1.01
EXACT LEAD LEAD2 LEAD3 EXACT LEAD LEAD2 LEAD3
-16.0 0.0000 0.0000 0.0000 0.0000 0.2160 0.2333 0.2169 0.2034
-12.0 0.0001 0.0001 0.0001 0.0001 0.2861 0.3045 0.2930 0.2755
-8.0 0.0047 0.0050 0.0046 0.0047 0.3800 0.3943 0.3906 0.3754
-6.0 0.0208 0.0223 0.0203 0.0211 0.4382 0.4482 0.4480 0.4344
-4.0 0.0730 0.0791 0.0705 0.0739 0.5032 0.5096 0.5121 0.5012
-3.5 0.0975 0.1059 0.0942 0.0975 0.5205 0.5263 0.5293 0.5187
-3.0 0.1293 0.1405 0.1257 0.1265 0.5382 0.5435 0.5471 0.5381
-2.8 0.1445 0.1570 0.1410 0.1399 0.5455 0.5506 0.5543 0.5469
-2.6 0.1614 0.1753 0.1584 0.1545 0.5528 0.5577 0.5616 0.5569
-2.4 0.1802 0.1954 0.1780 0.1710 0.5602 0.5649 0.5689 0.5689
-2.2 0.2011 0.2175 0.2002 0.1897 0.5678 0.5723 0.5763 0.5849
-2.0 0.2243 0.2417 0.2252 0.2115 0.5754 0.5797 0.5838 0.6092
-1.8 0.2501 0.2683 0.2533 0.2370 0.5831 0.5873 0.5870 *
-1.6 0.2789 0.2974 0.2845 0.2669 0.5909 0.5948 0.5956 *
-1.4 0.3111 0.3292 0.3191 0.3013 0.5988 0.6025 0.6035 *
-1.2 0.3471 0.3640 0.3571 0.3401 0.6068 0.6103 0.6101 *
-1.0 0.3876 0.4022 0.3984 0.3828 0.6149 0.6182 0.6131 *
-0.8 0.4328 0.4441 0.4433 0.4292 0.6230 0.6261 0.6031 *
-0.6 0.4826 0.4903 0.4920 0.4812 0.6313 0.6342 0.5265 *
-0.4 0.5361 0.5414 0.5450 0.5357 0.6396 0.6428 * *
-0.2 0.5939 0.5976 0.5989 * 0.6480 0.6558 * *
0.0 0.6566 0.6586 0.6646 0.6550 0.6565 0.6585 0.6645 0.6550
0.2 0.7227 0.7226 0.7304 0.6487 0.6650 0.6624 * *
0.4 0.7883 0.7859 0.7946 0.7874 0.6736 0.6745 * *
0.6 0.8475 0.8433 0.8531 0.8468 0.6823 0.6833 0.7737 *
0.8 0.8952 0.8904 0.8999 0.8944 0.6910 0.6917 0.7169 *
1.0 0.9300 0.9255 0.9336 0.9292 0.6997 0.7002 0.7116 *
1.2 0.9536 0.9500 0.9562 0.9530 0.7085 0.7087 0.7148 0.9275
1.4 0.9691 0.9664 0.9709 0.9687 0.7173 0.7172 0.7191 *
1.6 0.9792 0.9772 0.9804 0.9790 0.7260 0.7256 0.7338 0.6746
1.8 0.9858 0.9843 0.9866 0.9857 0.7348 0.7340 0.7422 0.7135
2.0 0.9902 0.9891 0.9907 0.9901 0.7435 0.7424 0.7508 0.7339
4.0 0.9995 0.9995 0.9995 0.9995 0.8265 0.8224 0.8327
0.8260
g(n) =  , if ½ß½
< 1, =
, if ½ß½
< 1, =  , if ½ß½
= 1 and =
, if ½ß½
= 1 and =  , if ½ß½
=1; EXACT is the exact probability computed by numerical integration
(Tsui, 1989); LEAD, LEAD2 and LEAD3 are, respectively the approximations
from the leading one, two and three terms in the expansion (2.7)
or (2.8).
, if ½ß½
=1; EXACT is the exact probability computed by numerical integration
(Tsui, 1989); LEAD, LEAD2 and LEAD3 are, respectively the approximations
from the leading one, two and three terms in the expansion (2.7)
or (2.8).
* the number is outside the range of (0, 1).
 - ) < x)
x ß = 1.0 ß = 1.01
EXACT LEAD LEAD2 LEAD3 EXACT LEAD LEAD2 LEAD3
-16.0 0.0000 0.0000 0.0000 0.0000 0.1967 0.2130 0.1969 0.1839
-12.0 0.0001 0.0001 0.0001 0.0001 0.2659 0.2839 0.2727 0.2533
-8.0 0.0035 0.0037 0.0034 0.0035 0.3612 0.3754 0.3730 0.3548
-6.0 0.0165 0.0177 0.0162 0.0167 0.4216 0.4311 0.4331 0.4163
-4.0 0.0622 0.0672 0.0601 0.0631 0.4901 0.4956 0.5008 0.4872
-3.5 0.0845 0.0916 0.0816 0.0850 0.5085 0.5133 0.5192 0.5055
-3.0 0.1140 0.1239 0.1106 0.1124 0.5274 0.5317 0.5382 0.5254
-2.8 0.1284 0.1395 0.1249 0.1251 0.5352 0.5392 0.5459 0.5341
-2.6 0.1445 0.1570 0.1413 0.1390 0.5431 0.5469 0.5538 0.5437
-2.4 0.1625 0.1763 0.1599 0.1544 0.5511 0.5546 0.5617 0.5545
-2.2 0.1827 0.1979 0.1812 0.1719 0.5592 0.5625 0.5697 0.5678
-2.0 0.2054 0.2218 0.2056 0.1923 0.5674 0.5705 0.5778 0.5862
-1.8 0.2308 0.2482 0.2333 0.2166 0.5758 0.5787 0.5859 0.6157
-1.6 0.2594 0.2774 0.2646 0.2455 0.5842 0.5869 0.5903 *
-1.4 0.2916 0.3095 0.2998 0.2796 0.5928 0.5953 0.5994 *
-1.2 0.3281 0.3450 0.3387 0.3190 0.6015 0.6037 0.6075 *
-1.0 0.3696 0.3842 0.3817 0.3630 0.6103 0.6123 0.6129 *
-0.8 0.4166 0.4276 0.4287 0.4114 0.6192 0.6210 0.6092 *
-0.6 0.4689 0.4760 0.4801 0.4642 0.6282 0.6298 0.5588 *
-0.4 0.5257 0.5301 0.5364 0.5235 0.6373 0.6390 0.0750 *
-0.2 0.5879 0.5905 0.5943 * 0.6465 0.6522 * *
0.0 0.6561 0.6568 0.6656 0.6542 0.6558 0.6564 0.6655 0.6541
0.2 0.7284 0.7270 0.7371 0.6866 0.6652 0.6620 * *
0.4 0.7995 0.7961 0.8065 0.7990 0.6747 0.6742 * *
0.6 0.8618 0.8570 0.8674 0.8611 0.6842 0.6838 0.7505 *
0.8 0.9094 0.9045 0.9138 0.9087 0.6937 0.6931 0.7149 *
1.0 0.9420 0.9379 0.9451 0.9414 0.7033 0.7024 0.7142 0.2491
1.2 0.9629 0.9597 0.9651 0.9625 0.7130 0.7118 0.7187 *
1.4 0.9760 0.9737 0.9774 0.9757 0.7226 0.7210 0.7318 0.6456
1.6 0.9842 0.9826 0.9852 0.9841 0.7322 0.7304 0.7410 0.7039
1.8 0.9894 0.9883 0.9900 0.9893 0.7418 0.7396 0.7503 0.7301
2.0 0.9928 0.9920 0.9932 0.9927 0.7514 0.7489 0.7596 0.7464
4.0 0.9997 0.9996 0.9997 0.9997 0.8405 0.8355 0.8470
0.8397
g(n) =  , if ½ß½
< 1, =
, if ½ß½
< 1, =  , if ½ß½
= 1 and =
, if ½ß½
= 1 and =  , if ½ß½
=1; EXACT is the exact probability computed by numerical integration
(Tsui, 1989); LEAD, LEAD2 and LEAD3 are, respectively the approximations
from the leading one, two and three terms in the expansion (2.7)
or (2.8).
, if ½ß½
=1; EXACT is the exact probability computed by numerical integration
(Tsui, 1989); LEAD, LEAD2 and LEAD3 are, respectively the approximations
from the leading one, two and three terms in the expansion (2.7)
or (2.8).
* the number is outside the range of (0, 1).
 )
)
x ß = 0.95 ß = 0.99
EXACT LEAD LEAD2 LEAD3 EXACT LEAD LEAD2 LEAD3
-16.0 0.0001 0.0001 0.0001 0.0001 0.0086 0.0094 0.0083 0.0088
-12.0 0.0012 0.0013 0.0012 0.0012 0.0209 0.0232 0.0199 0.0215
-8.0 0.0123 0.0131 0.0120 0.0124 0.0505 0.0566 0.0481 0.0495
-6.0 0.0331 0.0357 0.0322 0.0336 0.0803 0.0899 0.0790 0.0744
-4.0 0.0852 0.0923 0.0824 0.0854 0.1332 0.1450 0.1376 0.1261
-3.5 0.1077 0.1168 0.1046 0.1062 0.1530 0.1642 0.1592 0.1469
-3.0 0.1365 0.1479 0.1336 0.1313 0.1771 0.1868 0.1848 0.1720
-2.8 0.1502 0.1625 0.1477 0.1430 0.1882 0.1971 0.1965 0.1835
-2.6 0.1654 0.1787 0.1637 0.1560 0.2003 0.2082 0.2092 0.1961
-2.4 0.1822 0.1964 0.1817 0.1708 0.2136 0.2203 0.2231 0.2099
-2.2 0.2009 0.2159 0.2019 0.1877 0.2283 0.2335 0.2382 0.2252
-2.0 0.2218 0.2373 0.2248 0.2075 0.2446 0.2481 0.2550 0.2423
-1.8 0.2451 0.2609 0.2505 0.2306 0.2627 0.2643 0.2736 0.2616
-1.6 0.2713 0.2868 0.2793 0.2575 0.2832 0.2825 0.2945 0.2835
-1.4 0.3008 0.3154 0.3114 0.2884 0.3063 0.3031 0.3181 0.3086
-1.2 0.3341 0.3470 0.3470 0.3235 0.3328 0.3266 0.3449 0.3376
-1.0 0.3719 0.3820 0.3866 0.3628 0.3634 0.3539 0.3757 0.3712
-0.8 0.4146 0.4209 0.4304 0.4064 0.3992 0.3855 0.4113 0.4104
-0.6 0.4627 0.4644 0.4790 0.4554 0.4408 0.4226 0.4523 0.4564
-0.4 0.5165 0.5131 0.5328 0.5110 0.4891 0.4659 0.4994 0.5177
-0.2 0.5753 0.5673 0.5892 0.9894 0.5439 0.5157 0.5467 *
0.0 0.6385 0.6267 0.6553 0.6353 0.6037 0.5709 0.6117 0.6289
0.2 0.7041 0.6896 0.7207 0.6758 0.6654 0.6294 0.6773 0.0854
0.4 0.7683 0.7526 0.7836 0.7581 0.7246 0.6874 0.7321 0.7474
0.6 0.8261 0.8109 0.8395 0.8169 0.7776 0.7411 0.7858 0.8027
0.8 0.8738 0.8605 0.8846 0.8658 0.8222 0.7881 0.8316 0.8443
1.0 0.9101 0.8995 0.9185 0.9039 0.8583 0.8277 0.8687 0.8760
1.2 0.9365 0.9283 0.9426 0.9322 0.8868 0.8601 0.8977 0.8997
1.4 0.9551 0.9490 0.9594 0.9523 0.9092 0.8864 0.9199 0.9174
1.6 0.9680 0.9635 0.9710 0.9663 0.9266 0.9075 0.9367 0.9311
1.8 0.9770 0.9737 0.9790 0.9759 0.9404 0.9244 0.9495 0.9420
2.0 0.9832 0.9809 0.9847 0.9826 0.9512 0.9380 0.9592 0.9510
4.0 0.9988 0.9987 0.9989 0.9988 0.9912 0.9891 0.9924
0.9905
EXACT is exact the probability computed by numerical integration (Tsui, 1989); LEAD, LEAD2 and LEAD3 are, respectively the approximations from the leading one, two and three terms in the expansion (2.7) or (2.8).
* the number is outside the range of (0, 1).
n = 10, = .6065 n = 25, = .8187 n = 50, = .9048
x PERRON LARSSON EXACT LEAD EXACT LEAD EXACT LEAD
-16.7378 0.010 0.0110 0.0000 0.0000 0.0020 0.0020 0.0050 0.0051
-13.1743 0.025 0.0282 0.0004 0.0004 0.0083 0.0088 0.0156 0.0160
-10.4633 0.050 0.0580 0.0039 0.0038 0.0238 0.0250 0.0358 0.0369
-7.7242 0.100 0.1216 0.0242 0.0246 0.0627 0.0655 0.0808 0.0831
2.4561 0.900 NA 0.9127 0.9137 0.9068 0.9095 0.9038 0.9068
3.0637 0.950 NA 0.9573 0.9561 0.9551 0.9556 0.9532 0.9541
3.5239 0.975 NA 0.9761 0.9998 0.9773 0.9768 0.9766 0.9765
4.0342 0.990 NA 0.9869 0.9862 0.9899 0.9893 0.9902 0.9898
n = 10, = 1.0 n = 25, = 1.0 n = 50, = 1.0
x PERRON LARSSON EXACT LEAD EXACT LEAD EXACT LEAD
-13.6919 0.010 0.0115 0.0011 0.0011 0.0049 0.0054 0.0076 0.0078
-10.4399 0.025 0.0297 0.0079 0.0082 0.0169 0.0181 0.0210 0.0221
-8.0383 0.050 0.0616 0.0262 0.0276 0.0392 0.0424 0.0445 0.0478
-5.7133 0.100 0.1307 0.0724 0.0773 0.0871 0.0952 0.0941 0.1014
0.9280 0.900 0.8505 0.8618 0.8578 0.8850 0.8825 0.8931 0.8903
1.2854 0.950 0.9379 0.9151 0.9110 0.9376 0.9340 0.9442 0.9409
1.6122 0.975 0.9711 0.9473 0.9436 0.9656 0.9628 0.9705 0.9682
2.0325 0.990 0.9889 0.9710 0.9687 0.9844 0.9825 0.9875 0.9860
n = 10, = 1.221 n = 25, = 1.083 n = 50, = 1.041
x PERRON LARSSON EXACT LEAD EXACT LEAD EXACT LEAD
-12.0557 0.010 0.0125 0.0040 0.0043 0.0071 0.0079 0.0085 0.0093
-8.8762 0.025 0.0351 0.0174 0.0193 0.0214 0.0242 0.0234 0.0260
-6.5587 0.050 0.0890 0.0438 0.0501 0.0470 0.0537 0.0489 0.0551
-4.3431 0.100 0.9664 0.1002 0.1117 0.0988 0.1116 0.1003 0.1119
0.5191 0.900 0.8376 0.8445 0.8219 0.8788 0.8576 0.8901 0.8692
0.7585 0.950 0.9332 0.9034 0.8860 0.9334 0.9192 0.9425 0.9292
1.0067 0.975 0.9694 0.9398 0.9282 0.9631 0.9550 0.9699 0.9624
1.3550 0.990 0.9884 0.9675 0.9611 0.9831 0.9793 0.9870 0.9839
c is a reparameterization of (see Perron, 1991b) with = exp(-c/n); EXACT is the exact probability computed by simulation with one-half of one million replications; PERRON, LARSSON and LEAD are, respectively the approximations from Perron (1991b), Larsson (1995) and the leading term in the expansion (2.7) or (2.8).
NA: not available

n = 10, = .6065, n = 25, = .8187, n = 50, = .9048,
= 1.58 = 2.50 = 3.54
x PERRON EXACT LEAD EXACT LEAD EXACT LEAD
-13.8955 0.010 0.0000 0.0000 0.0021 0.0021 0.0050 0.0052
-10.9832 0.025 0.0003 0.0003 0.0090 0.0091 0.0160 0.0161
-8.7550 0.050 0.0039 0.0039 0.0253 0.0253 0.0369 0.0371
-6.4899 0.100 0.0250 0.0251 0.0656 0.0660 0.0825 0.0832
2.2695 0.900 0.9244 0.9249 0.9106 0.9129 0.9061 0.9082
2.8257 0.950 0.9684 0.9677 0.9591 0.9598 0.9547 0.9561
3.2413 0.975 0.9855 0.9846 0.9808 0.9807 0.9779 0.9786
3.6788 0.990 0.9937 0.9933 0.9924 0.9921 0.9913 0.9913
n = 10, = 1.00, n = 25, = 1.00, n = 50, = 1.00,
= 1.58 = 2.50 = 3.54
x PERRON EXACT LEAD EXACT LEAD EXACT LEAD
-10.9570 0.010 0.0011 0.0011 0.0056 0.0055 0.0076 0.0078
-8.3535 0.025 0.0081 0.0083 0.0177 0.0183 0.0213 0.0222
-6.4315 0.050 0.0264 0.0278 0.0405 0.0426 0.0456 0.0479
-4.5709 0.100 0.0731 0.0755 0.0898 0.0954 0.0951 0.1015
0.7643 0.900 0.8774 0.8717 0.8904 0.8870 0.8951 0.8920
1.0481 0.950 0.9303 0.9261 0.9423 0.9392 0.9460 0.9433
1.3042 0.975 0.9607 0.9577 0.9698 0.9673 0.9722 0.9703
1.6338 0.990 0.9814 0.9800 0.9872 0.9857 0.9884 0.9875
n = 10, = 1.2214, n = 25, = 1.0833, n = 50, = 1.0408,
= 1.58 = 2.50 = 3.54
x PERRON EXACT LEAD EXACT LEAD EXACT LEAD
-9.2554 0.010 0.0040 0.0043 0.0075 0.0080 0.0088 0.0095
-6.7080 0.025 0.0174 0.0194 0.0220 0.0246 0.0236 0.0265
-4.8444 0.050 0.0438 0.0496 0.0477 0.0540 0.0488 0.0556
-3.0206 0.100 0.0986 0.1038 0.1001 0.1068 0.0999 0.1078
0.3756 0.900 0.8646 0.8438 0.8859 0.8663 0.8929 0.8737
0.5401 0.950 0.9232 0.9091 0.9402 0.9271 0.9449 0.9327
0.7143 0.975 0.9579 0.9490 0.9689 0.9612 0.9717 0.9649
0.9680 0.990 0.9811 0.9771 0.9869 0.9835 0.9881 0.9855
c and are reparameterizations of and = y0/ (see Perron, 1991b) with = exp(-c/n) and = n1/2; EXACT is the exact probability computed by simulation with one-half of one million replications; PERRON and LEAD are, respectively the approximations from Perron (1991b), and the leading term in the expansion (2.7) or (2.8).
n = 10, = 0.3679 n = 25, = 0.6703 n = 50, = 0.8187
x PERRON EXACT LEAD EXACT LEAD EXACT LEAD
-18.478 0.010 0.0000 0.0000 0.0006 0.0005 0.0032 0.0032
-14.728 0.025 0.0000 0.0000 0.0037 0.0037 0.0111 0.0114
-11.834 0.050 0.0002 0.0002 0.0129 0.0136 0.0278 0.0286
-8.846 0.100 0.0045 0.0044 0.0426 0.0441 0.0688 0.0698
3.793 0.900 0.9553 0.9563 0.9267 0.9278 0.9143 0.9154
4.729 0.950 0.9861 0.9861 0.9704 0.9709 0.9613 0.9621
5.436 0.975 0.9947 0.9945 0.9879 0.9882 0.9828 0.9896
6.154 0.990 0.9979 0.9977 0.9961 0.9961 0.9939 0.9965
n = 10, = 0.9048 n = 25, = 0.9608 n = 50, = 0.9802
x PERRON EXACT LEAD EXACT LEAD EXACT LEAD
-11.848 0.010 0.0009 0.0009 0.0049 0.0051 0.0073 0.0075
-8.942 0.025 0.0066 0.0068 0.0161 0.0169 0.0203 0.0213
-6.831 0.050 0.0222 0.0229 0.0375 0.0395 0.0434 0.0459
-4.818 0.100 0.0634 0.0657 0.0842 0.0889 0.0922 0.0970
0.971 0.900 0.8864 0.8806 0.8940 0.8892 0.8976 0.8921
1.322 0.950 0.9357 0.9327 0.9447 0.9411 0.9475 0.9439
1.639 0.975 0.9628 0.9609 0.9709 0.9683 0.9730 0.9707
2.042 0.990 0.9814 0.9803 0.9873 0.9858 0.9888 0.9875
n = 10, = 0.9900 n = 25, = 0.9960 n = 50, = 0.9980
x PERRON EXACT LEAD EXACT LEAD EXACT LEAD
-8.168 0.010 0.0037 0.0041 0.0074 0.0077 0.0086 0.0092
-5.634 0.025 0.0154 0.0165 0.0214 0.0227 0.0234 0.0249
-3.906 0.050 0.0380 0.0416 0.0459 0.0496 0.0481 0.0523
-2.405 0.100 0.0880 0.0957 0.0959 0.1042 0.0978 0.1071
0.495 0.900 0.8864 0.8616 0.8942 0.8685 0.8981 0.8708
0.727 0.950 0.9377 0.9233 0.9446 0.9302 0.9474 0.9325
0.971 0.975 0.9654 0.9576 0.9713 0.9636 0.9730 0.9655
1.312 0.990 0.9837 0.9802 0.9877 0.9846 0.9886 0.9859
c is a reparameterization of (see Perron, 1991a) with = exp(-c/n); EXACT is the exact probability computed by simulation with one-half of one million replications; PERRON and LEAD are, respectively the approximations from Perron (1991a), and the leading term in the expansion (2.7) or (2.8).
= 0.2 = 0.8
x EXACT PHILLIPS WANG LEAD EXACT PHILLIPS WANG LEAD
1.0 0.2987 0.2926 0.2987 0.2988 0.3444 NA 0.3582 0.3572
1.4 0.1400 0.1283 0.1400 0.1400 0.2280 NA 0.2371 0.2372
1.8 0.0551 0.0274 0.0551 0.0550 0.1565 NA 0.1628 0.1629
2.2 0.0191 NA 0.0189 0.0190 0.1083 NA 0.1126 0.1126
2.6 0.0060 NA 0.0057 0.0056 0.0745 NA 0.0775 0.0774
3.0 0.0018 NA 0.0015 0.0015 0.0507 NA 0.0522 0.0525
EXACT is the exact probability as reported in Phillips (1978); PHILLIPS is the saddlepoint approximation given in Phillips (1978); WANG is the approximation given in Wang (1992); LEAD is the approximation from the leading term of the expansion (2.7) or (2.8).
NA: not available; the approximate density is not defined.
Abadir, K. M. (1993). "The Limiting Distribution of the Autocorrelation
Coefficient Under a Unit Root", The Annals of Statistics,
21, no. 2, 1058-70.
Abramowitz, M. and I. A. Stegun (1970). Handbook of Mathematical
Functions, Dover edition, ninth printing, New York: Dover
Publications, Inc.
Cavanagh, C. (1986). "Roots Local to Unity", mimeo,
Harvard University.
Cornish, E. A. and Fisher, R. A. (1937). "Moments and Cumulants
in the Specification of Distribution', Revue de l'institut
Internat. de Statist., 4, 307-20.
Cryer, J. D., J. C. Nankervis and N. E. Savin (1989). "Mirror-Image
Distributions in AR(1) Models", Econometric Theory,
5, 36-52.
Dickey, D. A. (1976). Estimation and Hypothesis Testing for
Nonstationary Time Series, Unpublished Ph. D. Dissertation,
Iowa State University, Ames, IW.
Dickey, D. A. and W. A. Fuller (1979). "Distribution of the
Estimators for Autoregressive Time Series with a Unit Root",
J. Amer. Statist. Assn., 74, 427-31.
Dickey, D. A. and W. A. Fuller (1981). "Likelihood Ratio Test for Autoregressive Time Series with a Unit Root", Econometrica, 49, 1057-1072.
Diebold, F. X. and M. Nerlove (1990). "Unit Roots in Economic
Time Series: A Selective Survey", Advances in Econometrics,
8, 3-69.
Evans, G. B. and N. E. Savin (1981). "Testing for Unit Roots:
I", Econometrica, 49, 753-79.
Evans, G. B. and N. E. Savin (1984). "Testing for Unit Roots:
II", Econometrica, 52, 1241-69.
Fisher, R. A. and E. A. Cornish (1960). "The Percentile Points
of Distributions Having Unknown Cumulants", Technometrics,
2, 209-26.
Fuller, W. A. (1976). Introduction to Statistical Time Series,
New York: Wiley
Gurland, J. (1948). "Inversion Formula for the Distribution
of Ratios", Annals of Mathematical Statistics, 19,
228-37.
Hasza, D. P. and W. A. Fuller (1979). "Estimation for Autoregressive
Processes with Unit Roots", Annals of Statistics,
7, 1106-20.
Hill, G. W. and A. W. Davis (1968). "Generalized Asymptotic
Expansions of Cornish-Fisher Type", Annals of Mathematical
Statistics, 39, 1264-73.
Hurwicz, L. (1950). "Least Squares Bias in Time Series",
in Statistical Inference in Dynamic Models, ed. by T. C.
Koopmans, New York: Wiley, 365-83.
Larsson, R. (1995). "The Asymptotic Distributions of Some
Test Statistics in Near-Integrated AR Processes", Econometric
Theory, 11, 306-30.
Lieberman, O. (1994). "Saddlepoint Approximation for the
Least Squares Estimator in First-Order Autoregression", Biometrika,
81, no. 4, 807-11.
Lugannani, R. and S. O. Rice (1980). "Saddle Point Approximation
for the Distribution of the Sum of Independent Random Variables",
Adv. Appl. Prob., 12, 475-90.
Mann, H. B. and A. Wald (1943). "On the Statistical Treatment
of Linear Stochastic Difference Equations", Econometrica,
11, 173-220.
Nabeya, S. and K. Tanaka (1990). "A General Approach to the
Limiting Distribution for Estimators in Time Series Regression
with Nonstable Autoregressive Errors", Econometrica,
58, 145-63.
Perron, P. (1989). "The Calculation of the Limiting Distribution
of the Least Squares Estimator in a Near-Integrated Model",
Econometric Theory, 5, 241-55.
Perron, P. (1991a). "A Continuous Time Approximation to the
Stationary First-Order Autoregressive Model", Econometric
Theory, 5, 241-55.
Perron, P. (1991b). "A Continuous Time Approximation to the
Unstable First-Order Autoregressive Process: The Case Without
an Intercept", Econometrica, 59, no. 1, 211-36.
Perron, P. and P. C. B. Phillips (1987). "Does GNP have a
Unit Root? A Reevaluation", Economic Letters, 23,
139-45.
Phillips, P. C. B. (1977). "Approximations to Some Finite
Sample Distributions Associated with the First Order Stochastic
Difference Equation", Econometrica, 45, 463-85.
Phillips, P. C. B. (1978). "Edgeworth and Saddlepoint Approxiamtions
in a First Order Noncircular Autoregression", Biometrika,
59, 79-84.
Phillips, P. C. B. (1988). "Regression Theory for Near-Integrated
Time Series", Econometrica, 56, 1021-1044.
Phillips, P. C. B. and P. Perron (1988). "Testing for a Unit
Root in Time Series Regression",Biometrika, 75, 335-46.
Rao, M. M. (1978). "Asymptotic Distribution of an Estimator
of the Boundary Parameter of an Unstable Process", Annals
of Statistics, 16, 185-90.
Rice, S. O. (1968). "Uniform Asymptotic Expansions for Saddle
Point Integrals - Applications to a Probability Distribution Occurring
in Noise Theory", Bell Syst. Tech. J., 47, 1971-2013.
Satchell, S. E. (1984). "Approximations to the Finite Sample
Distributions for Non-Stable First Order Difference Equations",
Econometrica, 52, 1271-88.
Schwert, G. W. (1987). "Effects of Model Specification on
Tests of Unit Roots in Macroeconomic Data", J. Monetary
Econ., 20, 73-103.
Stock, J. H. and W. W. Watson (1989). "Interpreting the Evidence
on Money-Income Causality", J. of Econometrics, 40,
161-81.
Tsui, A. K. (1989). On the Finite Sample Distribution of a
Least Squares Estimator in a First Order Autoregressive Model,
Unpublished Ph. D. Dissertation, University of Kentucky, Lexington,
Kentucky.
Tsui, A. K. and M. M. Ali (1992). "Approximations to the
Distribution of the Least SquaresEstimatorin a First Order Stationary
Autoregressive Model", Communications in Statistics -
Simulation, 21, no. 2, 463-84.
Tsui, A. K. and M. M. Ali (1994). "Exact Distributions, Density
Functions and Moments of the Least Squares Estimator in a First-Order
Autoregressive Model", Computational Statistics &
Data Analysis, 17, 433-54.
White, J. S. (1958). "The Limiting Distribution of the Serial
Correlation Coefficient in the Explosive Case", Annals
of Mathematical Statistics, 29, 1188-97.
White, J. S. (1961). "Asymptotic Expansions for the Mean and Variance of the Serial Correlation Coefficient", Biometrika, 48, 85-95.