Abstract: This paper uses average monthly returns and linear
spline regressions to investigate the relation between expected
return and firm size during 1980-1994. We find that the average
monthly returns are approximately constant across size deciles.
The estimated spline regressions vary substantially from year-to-year.
Our analysis of the year-by-year estimates suggests that the
annual regression function is essentially flat, except possibly
for the smallest two deciles. The results are similar for the
January and non-January months. Hence, the evidence does not
support the prevalent use of size as an explanatory variable for
returns during the 1980-1994 period.
We would like to thank Utpal Bhattacharya, Doug Foster, Todd Houge,
Jay Ritter, and Anand Vijh for helpful comments.
In this paper, we investigate the relation between expected return and firm size. Starting with the pioneering work of Banz (1981) and Reinganum (1981), this area has been one of the most researched topics in finance over the last 15 years. The previous research has raised two closely related questions: do small firms have higher expected returns than large firms, and is firm size a proxy for risk? The first question is about the shape of the returns regression function given firm size. This shape is an empirical issue and can be addressed by statistical analysis. The second question is more difficult to study precisely since there is no definitive measure of risk. The shape of the regression function, however, can shed substantial light on the risk story.
Our analysis is based on data from the New York Stock Exchange (NYSE), American Stock Exchange (Amex), and Nasdaq from 1980-1994. We analyze the data using average monthly returns and spline regressions. Following conventional methodology, firms are sorted into size deciles determined by NYSE firms where size is defined as the natural logarithm of the market value of equity from the last trading day of the prior year. The average monthly return is computed for the firms in each decile over the sample. We find that the average monthly returns are approximately constant across the size deciles. In other words, no relation between average monthly returns and size was found during the 1980-1994 period.
Our second statistical method is to fit a linear spline to the data. A linear spline is a continuous piecewise linear function, that is, a continuous function composed of straight lines. The size deciles naturally define the cutoffs for the beginning and ending of each straight line. The motivation for using the linear spline is that any continuous regression function can be approximated arbitrarily well by a piecewise linear function. As a result, the linear spline is a simple procedure for obtaining a nonparametric estimate of the regression function of return given size. By contrast, the average monthly returns method does not provide an estimate of the regression function.
Three different spline regressions were estimated, based on the deciles: an annual regression for each calendar year; a January regression; and a February through December regression. We find that the annual spline regressions vary substantially from year-to-year. Our analysis suggests that the annual regression function is essentially flat except possibly for the smallest two size deciles, which is consistent with the analysis based on average monthly returns. Similar conclusions are obtained from the analysis of the spline regressions for January and the non-January months.
Our spline regression results are not a special feature of our data set. We also estimated the spline regressions using the Fama and French (1992) data, which covers the period 1963-1990, and found qualitatively similar results. The method used by Fama and French is different from the one we employ. They run a least squares regression of return given size for every month and take the average of the least squares slopes. Their method gives the average slope of the monthly linear regressions of return given size. The disadvantage of this method is that it ignores the possible nonlinearity of the regression function within each month. This is an important oversight.
Fama and French (1992) and Berk (1995) have argued that small firms have higher risk which is compensated by higher returns. Small firms may be riskier, but there is no compelling evidence that during 1980-1994 small firms have had higher expected returns. While some small stocks exhibited extremely high returns, the question is whether an investor can realize substantial profit trading the shares of such firms. We document that high returns for small firms do not always imply large profits for investors.
The rest of the paper is organized as follows. Section 1 describes
the data. Section 2 presents the empirical findings using monthly
average returns. Section 3 describes the linear spline methodology
and Section 4 provides the results using spline regression. Section
5 discusses the impact and implementation of the extreme returns.
The last section summarizes the findings and offers a conclusion.
1. Data
The data consists of all New York Stock Exchange (NYSE), American Stock Exchange (Amex), and Nasdaq operating firms (American Depository Receipts, closed-end funds, and real estate investment trusts are excluded) listed on the 1994 University of Chicago Center for Research in Security Prices (CRSP) daily tapes on the last day of a calendar year during 1979-1993. The aggregate sample includes more than 85,000 firm years. Monthly stock returns (dividends plus capital gains) are constructed by compounding the daily returns within the month. For firms delisted prior to the end of a month, the daily value-weighted CRSP NYSE-Amex Index return is spliced in for the remaining days of the month.
Decile cutoffs are determined each year by ranking all NYSE firms on the basis of market value (shares outstanding times share price) determined on last day of the prior calendar year (December 31 of year t-1). The market value cutoffs are calculated by having an equal number of NYSE firms within each size decile each calendar year. Since most Nasdaq and Amex firms have smaller market values than the typical NYSE firm, the vast majority of firms are located in the bottom size deciles.
2. Analysis of Monthly Average Returns
2.1 Average monthly returns for NYSE, Amex, and Nasdaq firms
The conventional analysis of the size effect is based on average monthly returns. Keim (1983), Fama and French (1992, 1993), Reinganum (1981, 1983), and Stoll and Whaley (1983) compute the average return for various size groups and report a strong size pattern. Some of the empirical results are subject to a survivor bias. For example, Fama and French (1992, 1993) require their sample firms to be listed on both the CRSP and Compustat tapes. As shown by Kothari, Shanken, and Sloan (1995), this data requirement overstates the results of Fama and French because of Compustat's well known tendency to back-fill the accounting data on small firms which subsequently were extreme winners. This Compustat bias is strongest in the lower size deciles.
Table 1 presents the equally weighted average monthly returns for all firms during 1980-1994. Each firm in each month is weighted equally within its size decile. Since we do not require the use of Compustat data, the reported averages are unaffected by survivor bias. The results in the panel do not appear to support the prior finance literature on the small firm effect. The average monthly return for the smallest size decile is 1.25 percent compared to 1.21 percent for the largest size decile. For each decile, the standard error of the average monthly return, which is given in parentheses, is the standard deviation of the 180 monthly averages. Figure 1 plots the average monthly returns across size deciles.
This finding of no relationship with size and return during the last 15 years of CRSP data is troublesome for the numerous asset pricing papers using size (market capitalization) as an explanatory variable. The standard procedure, proposed by Fama and French (1992) and others, is to report risk adjusted returns by adjusting for size and other factors such as book-to-market. Since there has clearly been no recent relationship between size and return, why has the literature continued the use of size to root out empirical anomalies? It is unclear that the size screen is adding any power to the analysis.
Consistent with the previous research, small firms have higher average returns in the month of January compared to large firms. The smallest size decile averages 8.82 percent compared to 2.14 percent for the largest size decile, with standard errors of 1.827 and 1.398 respectively. The standard errors are the standard deviations of the 15 monthly averages. The last column of Table 1 reports that the smallest size decile averages only 56 basis points per month outside of January while the largest seven size deciles average over 100 basis points per month.
2.2 Average monthly returns for NYSE and Amex firms
Since some of the previous research focused only on NYSE and Amex firms, Table 2 reports the equally weighted average monthly returns for NYSE and Amex firms during 1980-1994. Only NYSE firms are used to determine the yearly size decile cutoffs. The patterns in Table 2 are quite similar to the results reported in Table 1. Average monthly returns for the smallest size decile are 1.41 percent compared to 1.30 percent for size decile five and 1.20 percent for the largest decile. The return in January for the smallest size decile is over 10 percent compared to about 9 percent when the sample includes all firms (NYSE, Amex, and Nasdaq). Figure 2 plots the average monthly returns across size deciles for NYSE and Amex firms.
The results from Table 2 indicate that differences between value and growth characteristics do not account for the lack of a size effect. Historically, small firms on the NYSE and Amex would mostly be categorized as value firms (i.e., high book-to-market ratio and low sales growth), because of a decline (at some point in time) in their stock price. The typical small Nasdaq firm would likely be categorized as a growth firm (i.e., low book-to-market ratio and high sales growth). Most of the small Nasdaq firms may have always been small compared to the typical NYSE firm. Thus, Table 2 shows that without Nasdaq firms, there has been no economically important small firm effect during 1980-1994.
The fact that there has been no recent small firm effect is not surprising in a historical context. Ibbotson (1995, Table 1-1) reports an average compound annual rate of return by decade of 10.95 percent for large companies compared to 11.14 percent for small companies. His time period is from 1926 to 1994, and he equally weights each decade. Thus, from a historical perspective, investors of small firms have not received substantially higher returns compared to the returns on large firms.
A formal statistical analysis based on average monthly returns
is complicated by correlation within and across size deciles.
Within each size decile, we have a time series of 180 monthly
averages. An analysis of this time series shows that the averages
are autocorrelated. Across size deciles, the monthly averages
are also correlated. For each month the average returns are highly
correlated across the deciles. For example, the average January
returns for the smallest and largest deciles are correlated.
The problems posed by the correlations can be addressed by analyzing
the data at a more disaggregated level. In the next section,
we conduct a formal statistical analysis using a linear spline
regression.
3. Spline Methodology
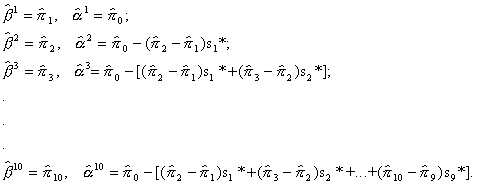
In this paper, the relation between expected return and size (natural logarithm of the market value of equity as of December 31 of the prior calendar year) is interpreted a population regression function. We estimate the population regression function using a linear spline. A linear spline is a continuous piecewise linear function. The basic idea is that any continuous function can be approximated arbitrarily well by a piecewise linear function, that is, a continuous function composed of straight lines. One linear segment represents the function for size values below s1*. Another linear segment represents the function for values between s1* and s2*, and so on. The linear segments are arranged so that they join at s1*, s2*,..., which are called knots. In our application the knots are determined by the size deciles, or more precisely, by the endpoints of the size intervals.
Formally, the function we want to estimate is:
Expected Return = a1 + b1 size if size < s1*,
a2 + b2 size if size ³ s1* and < s2*,
a3 + b3 size if size ³ s2* and < s3*,
. .
. .
. .
a10 + b10 size if size ³ s9*,
where the specific values for the thresholds, s1*,..., s9*, are the knots.
Introducing the dummy variables d1+i = 1 if size ³ si*, i = 1,2,...,9, and imposing the restriction that the linear segments join at the knots, the ten equations can be combined into the following equation:
Expected Return = p0 + p1 z1+ d2 p2 z2 + d3 p2 z3 +...+ d10 p10 z10 (1)
where the regressors are
z1 = size if size < s1* and s1* if size ³ s1*;
z2 = 0 if size £ s1*, size - s1* if s1* < size < s2*and s2*- s1* if size ³ s2*;
z3 = 0 if size £ s2*, size - s2* if s2* < size < s3*and s3*- s2* if size ³ s3*;
.
.
.
z10 = 0 if size £ s9* and size - s9* if size > s9*.
Since we do not observe the population regression function itself,
we have to estimate it from data. The linear spline is estimated
by applying least squares to equation
(1). The estimates of the ten segments of the linear spline are obtained as follows:
These estimates of the linear spline segments are not the same as those obtained by running a least squares regression on the data in each decile separately and piecing together the separate least squares lines. As a consequence, the slope of the estimated spline for a given size decile is not equal to the slope of the separate least squares line for that decile. For a brief treatment of the linear spline, see Greene (1993, pp. 235-238).
In practice, one must decide on the number of groups. Increasing the number of groups increases the accuracy with which the spline can approximate the true but unknown function, but it decreases the number of observation per group. Consequently, a tradeoff must be made between the bias due to having too few groups and the variance due to having too many groups. Choosing the optimal number of groups is a difficult problem for which there is no fully satisfactory solution. Following the finance literature, we used ten groups, or deciles, for the purpose of analysis. To check whether this number captured the main features of the population regression function, we also estimated the linear spline using 20 groups. This did not appreciably change the results.
To graphically display the spline regressions, we need identical
yearly decile cutoffs. That is, only one set of decile cutoffs.
Thus, to enhance comparisons, we created decile cutoffs by pooling
all NYSE firms after placing all market values into 1994 dollars.
Although this procedure has a look-ahead bias, all of our spline
regression results are unaltered if we instead placed firms into
yearly determined size deciles.
4. Spline Regression Results
The spline analysis was carried out for the full year, January, and February through December periods. The results of the analysis are presented in two kinds of graphs. One presents the estimated expected (predicted) return as a function of size and due to their appearance, they are referred to as spaghetti graphs. The other graph presents the estimated slopes within each decile. We refer to these as bubble graphs.
Figures 3, 4, and 5 (spaghetti graphs) show the estimated expected returns as a function of firm size. Figure 3 is for the full year; Figure 4 is for January; and Figure 5 is for February-December. Note that Figures 3 and 5 look very similar.
In the figures, the size scale (log of market capitalization) on the x-axis varies from roughly -3 to 12. This corresponds to a variation in market capitalization from approximately $50,000 to $100 billion in 1994 dollars. The dotted vertical line represents the upper bound of the first decile. The cutoff for the first decile is approximately 4.1 which corresponds to $60 million. Although slightly less than half the graph is in the first decile (-3 to 4.1), this represents only 2 percent of the total market capitalization. By contrast, a much smaller proportion of the graph is in the tenth decile (8.3 to 12), but this decile represents 54 percent of the total market capitalization.
The main message from these figures is that no consistent relation exists between firm size and expected return. There is a wide range of variation in the estimated relation across the years. Even the signs of the slopes for a given decile vary across the years. The most striking feature of the spaghetti graphs is that after the first decile the slopes are often positive. Notice, for example, that in the second decile, the slopes are overwhelmingly positive.
This observation is explored further in Figures 6, 7, and 8 (bubble graphs). Again, Figure 6 is for the full year; Figure 7 is for January; and Figure 8 for the remaining months. Fama and French (1992) also focused on the estimated monthly slopes. However, they ran a least squares regression of return on size for every month and took the average of the least squares slopes. Following the spirit of Fama and French (1992), the bubble graphs treat the slope of the relation between size and returns as a random variable. Each year provides a new draw of the slope function. One can then ask whether the average slope is negative (or positive). The bubbles in the graphs show the estimated slopes in each of the 15 years and ten size groups. The solid lines show the average estimated slopes, and the long-dash lines indicate the location of a slope of zero. The dotted lines indicate a joint confidence band for the true but unknown mean slopes.
The interpretation of these bands is that, subject to the approximation described below, they contain the true but unknown means with a probability that is at least 95 percent. In Figure 6 (full year), the confidence band excludes zero only in the second decile. Further, the average of the decile slopes is essentially zero in all but the second decile where it is positive. In Figure 7 (January), the confidence band excludes zero only in the first and third deciles. In these deciles, the mean slope is negative, although it can be seen that the slopes of individual years are not always negative. In other words, the relation between size and return in these deciles is negative on average but not in every year. In the remaining deciles, there is no basis for concluding that the mean slope of the relation between size and return is different from zero. Finally, in Figure 8 (February-December), the confidence band unambiguously excludes zero only in the second decile. In the second decile, the mean and individual slopes are positive.
In summary, the graphs reveal that the relation between size and return is highly variable from year-to-year. Moreover, for the full year and February-December periods, with the exception of size decile two, there is no evidence that the mean slope differs from zero. And similarly for January, with the exception now being in size deciles one and three.
The confidence bands assume that the sample mean of the estimated slopes is approximately normally distributed. The central limit theorem insures that this is an accurate approximation if the sample size is sufficiently large. In small samples (such as ours, whose size is 15), the approximation is likely to produce confidence bands that are too narrow. In other words, "exact" bands would be wider and, therefore, more likely to contain zero. In addition, the bands are also based on the Bonferroni inequality, so they have (approximate) a coverage probability that is at least 95 percent, not exactly 95 percent. The Bonferroni inequality is a way of obtaining joint confidence intervals for parameters whose estimates are not independent of one another (i.e., our mean slopes).
As a further check of our results, we estimated the spline regression functions using the pooled data. In unreported results, the spline regression for the full year was estimated using the combined data for all fifteen years. Not surprisingly given our previous results, the slopes for deciles three to ten were not significantly different zero using the standard F-test. The same qualitative results were obtained for the pooled January and the pooled February-December spline regressions.
In addition, we estimated the pooled regression using a generalized
least squares procedure to account for the heteroskedasticity
of the returns. For this purpose, we estimated the standard deviation
of the returns within each decile using the pooled data and then
divided the regressors (including the intercept) by the estimated
standard deviations. The spline regressions with the transformed
variables were re-estimated by least squares (with no intercept).
The results were qualitatively similar to those obtained by ordinary
least squares with the exception of the full year regression.
For this regression, the estimated slope for the ninth decile
was negative and significantly different from zero.
5. Impact of Outliers
Recent evidence by Fama and French's (1995, Figure 3) shows exceptionally low earnings relative to book value for small firms (both value and growth) during the 1980s and early 1990s. In light of this finding, it is a little surprising that small and large firms have approximately the same average monthly return. One would expect sharply lower stock returns for the small firms compared to large firms. Part of the failure to detect the low returns for small firms may be masked by a handful of outliers in the smaller size deciles.
To examine the impact of outliers on the average monthly returns, we report the total number of monthly firm returns equal or greater than 100 percent by size decile in Panel A of Table 3. Not surprisingly, the extreme performers are clustered within the smallest size decile. Monthly returns of at least 100 percent occurred a total of 2190 times in the smallest size decile compared to only seven times in the top five size deciles. Since NYSE firms determine the size decile cutoffs and Nasdaq firms are usually young small firms, the vast majority of firms are located in the smaller size deciles.
The last column of Panel A of Table 3 lists the percentage of firms with a monthly return of at least 100 percent. Slightly less than one half of one percent of the monthly returns in the smallest size decile have a return of 100 percent. This is a substantially larger percentage than exists for the larger size deciles. For example, in size decile four only 0.012 percent of the firms have monthly returns of at least 100 percent. The largest two size deciles have no firms with a monthly return of at least 100 percent.
The impact of these extreme monthly returns is presented in Panel B of Table 3. If we exclude firms with a monthly return greater than 100 percent from that particular month, the average monthly return for the smallest size decile drops from 1.25 percent to 0.57 percent. This is a 54 percent decline in the monthly return for the smallest size decile. The other nine size deciles do not experience a noticeable decline when extreme returns are excluded. Clearly, a small percentage of the total number of firms within the smallest size decile have a huge impact on the total average returns.
The vast majority of the finance literature simply reports the mean returns for various size deciles without listing the names of the actual extreme performers, their stock prices, or the trading volume of the firm. To examine the characteristics of these outliers, Table 4 reports the largest 25 January firm returns during 1980-1994. The firm's name, December and January prices, CRSP return, total trading volume on the last day of December, and total possible trading gain are reported in the table.
O C G Technology had the highest return (2400 percent in January of 1992) of any firm during the time period. The firm had 46,500 shares traded on the last day of the previous December. Assuming that an investor could buy the stock at the CRSP listed price on December and sell the stock at the CRSP listed price on January 31, an investor would have gained a total of $52,313 for the trade (($1.172 minus $0.047) times 46,500 shares).
The startling feature of Table 4 is that all 25 firms have a December 31 price of less than $1. Even after experiencing an extreme return, several of firms have a January 31 price of less than $1. For example, both Berkey Inc. and Colorocs Corp. go from a $1/32 share price on December 31 to a share price of $3/8 on January 31, a 1100 percent return which would present huge implementable problems for all investors. The last column reports the total possible gain from the 25 highest January returns. The highest possible gain was $406,425 (Modtech Inc) and the lowest gain was $787 (Oil City Petroleum). The median trading gain is only $30,545.
This suggests that high returns for small firms do not imply large profits. A median trading gain of $30,545 for an ex-post sample of extreme winners, without accounting for transaction costs, is of no value for the vast majority of money managers.
As added proof that the smallest firms are driving the size effect, Table 5 reports the average monthly returns for all firms with a market capitalization of at least $10 million (in 1994 dollars). Panel A, for comparison purposes, reports the average returns without the market value screen. In Panel B, the average monthly returns for the smallest size decile drops from 1.25 percent without the screen to 0.84 percent when a $10 million screen is applied. Since the cutoff between the first and second size decile is always above $10 million, the screen only affects the smallest size decile. Figure 8 plots the average monthly returns across size deciles for NYSE, Amex, and Nasdaq firms with a market capitalization of at least $10 million.
Outside of January, firms in the smallest size decile with at
least $10 million in market value average only 29 basis points
per month compared to over 100 basis points for the largest seven
size deciles. For firms above $10 million in market value, a
size effect in the opposite direction is present. That is, for
a sample excluding the smallest of firms, larger firms have substantially
higher returns than firms in the lowest two size deciles.
6. Conclusion
This paper examines whether small firms have higher expected returns than large firms. The analysis is based on data from the NYSE, Amex, and Nasdaq during 1980-1994. The evidence from the spline regressions as well as the analysis of the average monthly returns shows no systematic relation between size and return. In other words, the regression function of return given size is essentially flat.
This finding is troublesome for asset pricing papers using size (market capitalization) as an explanatory variable for returns during the 1980-1994 time period. The standard procedure, proposed by Fama and French (1992) and others, is to report risk adjusted returns by adjusting for size and other factors such as book-to-market. Since there has clearly been no relationship between size and return in the most recent 15 years of CRSP data, why has the literature continued the use of size to root out empirical anomalies? It is unclear that adjusting for size is adding any power to the analysis.
Our results are consistent with the two key features of the data on the compound annual rates of return by decade compiled by Ibbotson (1994, Table 1-1). The first is that the compound rates are highly variable for both large and small firms across the decades from 1926 to 1994, and the second is that there is virtually no difference between the average of the compounded rates across the decades for small and large firms.
We find that outliers account for more than half of the average
returns in the smallest size decile. In addition, applying a
simple market capitalization screen of $10 million (in 1994 dollars)
lowers the average monthly return for the smallest size decile
to only 84 basis points per month compared to over 120 basis points
for the top six size deciles. Simple adjustment for extreme outliers
provide strong evidence that small firms (especially those in
the smallest size decile) have economically important lower average
returns than firms in the larger size deciles. Thus, the paradox
is not why small firms have higher returns than large firms.
But, why the opposite is true.
Footnotes
1 For firms delisted from the exchanges during the calendar year, we splice in, on a point-forward basis, the value-weighted NYSE/Amex Index. Hence, all regressions have the same number of observations for a given cohort year.
2 This trading strategy ignores commission costs and
assumes that selling the shares on January 31 would not affect
prices. It also assumes that all shares traded could be purchased
by the trader on the last day of the previous month. As shown
by Keim (1989), there are systematic tendencies for CRSP closing
prices to be "bids" in late December.
References
Banz, Rolf W., 1981, "The Relationship between Return and
Market Value of Common Stocks," Journal of Financial Economics
9, 3-18.
Berk, Jonathan R., 1995, "A Critique of Size-Related Anomalies,"
Review of Financial Studies 8, 275-286.
Fama, Eugene F., and Kenneth R. French, 1992, "The Cross-Section
of Expected Stock Returns," Journal of Finance 47,
427-465.
Fama, Eugene F., and Kenneth R. French, 1993, "Common Risk
Factors in the Returns on Stocks and Bonds," Journal of
Financial Economics 33, 3-56.
Fama, Eugene F., and Kenneth R. French, 1995, "Size and Book-to-Market
Factors in Earnings and Returns," Journal of Finance
50, 131-155.
Greene, William H., 1993, Econometric Analysis, Macmillan Publishing
Company, New York.
Ibbotson Associates, 1995, Stock, bonds, bills, and inflation
1995 yearbook.
Keim, Donald B., 1983, "Size-Related Anomalies and Stock
Return Seasonality: Further Empirical Evidence," Journal
of Financial Economics 12, 13-32.
Keim, Donald B., 1989, "Trading Patterns, Bid-Ask Spreads,
and Estimated Security Returns," Journal of Financial
Economics 25, 75-97.
Kothari, S.P., Jay Shanken, and Richard G. Sloan, 1995, "Another
Look at the Cross-Section of Expected Stock Returns," Journal
of Finance 50, 185-224.
Reinganum, Marc R., 1981, "Misspecification of Capital Asset
Pricing: Empirical Anomalies Based on Earnings' Yields and Market
Values," Journal of Financial Economics 9, 19-46.
Reinganum, Marc R., 1983, "Portfolio Strategies Based on
Market Capitalization," Journal of Portfolio Management,
29-36.
Stoll, Han R. and Robert E. Whaley, 1983, "Transaction Costs and the Small Firm Effect," Journal of Financial Economics 12, 57-79.
Table 1
Average monthly percentage returns for NYSE, Amex, and Nasdaq
firms during 1980-1994
The sample universe includes all NYSE, Amex, and Nasdaq operating
firms (no ADRs, closed-end funds, REITs) listed on the CRSP daily
tapes on December 31 of year t-1. Monthly stock returns (dividends
plus capital gains) are constructed by compounding the daily returns
within the month. For firms delisted prior to the end of a month,
the daily value-weighted CRSP NYSE-Amex Index return is spliced
in for the remaining days of the month. Each year, size deciles
(price times shares outstanding as of December 31 of year t-1)
are created using only NYSE firms to determine market capitalization
cutoffs. The average monthly return equally weights each of the
180 months during the fifteen year period. The standard errors
from the monthly return time-series are in parentheses.
Table 2
Average monthly percentage returns for NYSE and Amex firms
during 1980-1994
The sample universe includes all NYSE and Amex operating firms
(no ADRs, closed-end funds, REITs) listed on the CRSP daily tapes
on December 31 of year t-1. Monthly stock returns (dividends
plus capital gains) are constructed by compounding the daily returns
within the month. For firms delisted prior to the end of a month,
the daily value-weighted CRSP NYSE-Amex Index return is spliced
in for the remaining days of the month. Each year, size deciles
(price times shares outstanding as of December 31 of year t-1)
are created using only NYSE firms to determine market capitalization
cutoffs. The average monthly return equally weights each of the
180 months during the fifteen year period. The standard errors
from the monthly return time-series are in parentheses.
Table 3
Total number of firms within size deciles with a monthly return
equal to or over 100 percent, 1980-1994
The sample universe includes all NYSE, Amex, and Nasdaq operating
firms (no ADRs, closed-end funds, REITs) listed on the CRSP daily
tapes on December 31 of year t-1. Monthly stock returns (dividends
plus capital gains) are constructed by compounding the daily returns
within the month. Each year, size deciles (price times shares
outstanding as of December 31 of year t-1) are created using only
NYSE firms to determine market capitalization cutoffs. Column
3 of Panel A reports the total number of firm months within each
size decile. Column (4) of Panel A reports column (2) divided
by column (3).
Panel A: Number of Firms (NYSE, Amex, and Nasdaq)
|
|
|
|
Panel B: Average Monthly Percentage Returns (NYSE, Amex, and Nasdaq)
|
|
|
|
Table 4
The highest 25 January returns, 1980-1994
The table contains the highest 25 returns within any January during
1980-1994. Monthly stock returns (dividends plus capital gains)
are constructed by compounding the daily returns within the month.
The closing price from the CRSP tapes may be either an ask price,
a bid price, or a trade within the listed spread. The total trading
volume is the last non-zero CRSP volume from December of year
t-1. Column (8) is calculated by multiplying the total trading
volume on the last day of December of year t-1 multiplied by the
total return in January of year t. This assumes that a trader
could buy at the December 31 price and sell at the January 31
price.
|
|
|
|
|
|
|
|
| O C G Technology | 46500 | $52,313 | |||||
| Berkey Inc | 17000 | $5,844 | |||||
| Colorocs Corp | 158748 | $54,570 | |||||
| Club-Theatre Network | 28900 | $20,779 | |||||
| Leesburg Land & Min. | 4100 | $6,470 | |||||
| A W Computer System | 24800 | $32,166 | |||||
| Koger Properties | 268500 | $314,682 | |||||
| Oil City Petroleum | 1200 | $787 | |||||
| Bonneville Pacific | 394365 | $61,817 | |||||
| Cellular Products | 19400 | $12,125 | |||||
| Biopharmaceutics Inc | 60600 | $189,375 | |||||
| W T C Industries | 61100 | $150,856 | |||||
| Major Group | 16300 | $5,868 | |||||
| F P A Corp | 4400 | $4,950 | |||||
| Besicorp | 2500 | $7,578 | |||||
| Ivenson Technology | 10500 | $13,776 | |||||
| Intermark Inc | 42800 | $5,339 | |||||
| Flextronics Inc | 70862 | $35,431 | |||||
| Exploration Company | 19900 | $7,463 | |||||
| Modtech Inc | 270950 | $406,425 | |||||
| Granada Biosciences | 54500 | $81,750 | |||||
| US Home Corp | 227700 | $270,280 | |||||
| Cabre Corp | 1000 | $1,281 | |||||
| Vector Graphic Inc | 44462 | $30,545 | |||||
| L V I Group Inc | 23600 | $53,100 | |||||
Table 5
Average monthly percentage returns for NYSE, Amex, and Nasdaq
firms during 1980-1994
The sample universe includes all NYSE, Amex, and Nasdaq operating
firms (no ADRs, closed-end funds, REITs) listed on the CRSP daily
tapes on December 31 of year t-1. Monthly stock returns (dividends
plus capital gains) are constructed by compounding the daily returns
within the month. Each year, size deciles (price times shares
outstanding as of December 31 of year t-1) are created using only
NYSE firms to determine market capitalization cutoffs. The average
monthly return equally weights each of the 180 months during the
fifteen year period. The standard errors from the monthly return
time-series are in parentheses.
Panel A: All firms (NYSE, Amex, and Nasdaq)
Panel B: All firms (NYSE, Amex, and Nasdaq) with market capitalization
of $10 million and above (in 1994 dollars)
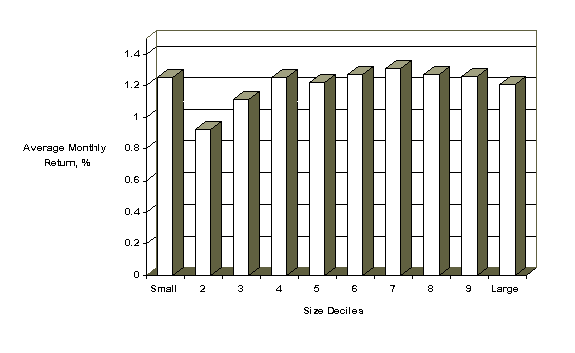
Figure 1. Average Monthly Percentage Returns for NYSE, Amex,
and Nasdaq Firms during 1980-1994. The sample universe includes
all operating firms (no ADRs, closed-end funds, REITs) listed
on the CRSP daily tapes on December 31 of year t-1. Monthly stock
returns (dividends plus capital gains) are constructed by compounding
the daily returns within the month. For firms delisted prior
to the end of a month, the daily value-weighted CRSP NYSE-Amex
Index return is spliced in for the remaining days of the month.
Each year, size deciles (price times shares outstanding as of
December 31 of year t-1) are created using only NYSE firms to
determine market capitalization cutoffs. The average monthly
return equally weights each of the 180 months during the fifteen
year period.
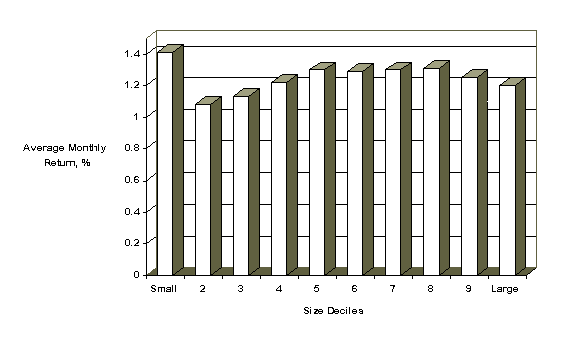
Figure 2. Average Monthly Percentage Returns for NYSE and
Amex Firms during 1980-1994. The sample universe includes
all NYSE and Amex operating firms (no ADRs, closed-end funds,
REITs) listed on the CRSP daily tapes on December 31 of year t-1.
Monthly stock returns (dividends plus capital gains) are constructed
by compounding the daily returns within the month. For firms
delisted prior to the end of a month, the daily value-weighted
CRSP NYSE-Amex Index return is spliced in for the remaining days
of the month. Each year, size deciles (price times shares outstanding
as of December 31 of year t-1) are created using only NYSE firms
to determine market capitalization cutoffs. The average monthly
return equally weights each of the 180 months during the fifteen
year period.
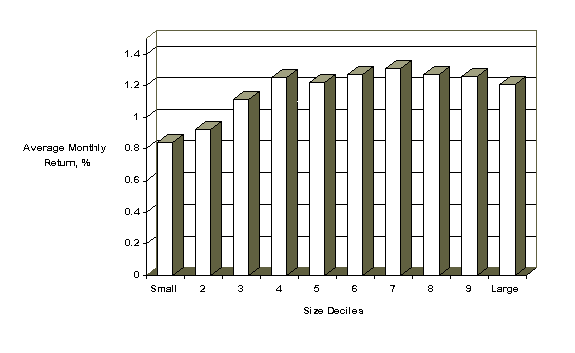
Figure 9. Average Monthly Percentage Returns for NYSE, Amex,
and Nasdaq Firms with a Market Capitalization of at least $10
Million during 1980-1994. The sample universe includes all
operating firms (no ADRs, closed-end funds, REITs) listed on the
CRSP daily tapes on December 31 of year t-1. Firms must have
a market capitalization of at least $10 million (in 1994 dollars)
to be included in the sample. Monthly stock returns (dividends
plus capital gains) are constructed by compounding the daily returns
within the month. For firms delisted prior to the end of a month,
the daily value-weighted CRSP NYSE-Amex Index return is spliced
in for the remaining days of the month. Each year, size deciles
(price times shares outstanding as of December 31 of year t-1)
are created using only NYSE firms to determine market capitalization
cutoffs. The average monthly return equally weights each of the
180 months during the fifteen year period.
Figure 3. Predicted returns from annual spline regressions,
1980-1994. The fifteen annual spline regressions of return
on size (the natural logarithm of the market value of equity)
were estimated for each year, 1980 to 1994. The knots used in
the spline regressions are the endpoints of the size deciles where
the deciles are determined by only NYSE firms. The sample consists
of all NYSE, Amex, and Nasdaq firms on the CRSP tapes, present
on the last day of the prior calendar year.
Figure 4. Predicted returns from January spline regressions,
1980-1994. The fifteen January spline regressions of return
on size (the natural logarithm of the market value of equity)
were estimated for each year, 1980 to 1994. The knots used in
the spline regressions are the endpoints of the size deciles where
the deciles are determined by only NYSE firms. The sample consists
of all NYSE, Amex, and Nasdaq firms on the CRSP tapes, present
on the last day of the prior calendar year.
Figure 5. Predicted returns from February-December spline regressions,
1980-1994. The fifteen February-December spline regressions
of return on size (the natural logarithm of the market value of
equity) were estimated for each year, 1980 to 1994. The knots
used in the spline regressions are the endpoints of the size deciles
where the deciles are determined by only NYSE firms. The sample
consists of all NYSE, Amex, and Nasdaq firms on the CRSP tapes,
present on the last day of the prior calendar year.
Figure 6. Slope coefficients from annual spline regressions,
1980-1994. The fifteen annual spline regressions of return
on size (the natural logarithm of the market value of equity)
were estimated for each year, 1980 to 1994. For each year, the
estimated slope for each size decile is represented by a circle
(bubble). The size deciles are determined by only NYSE firms.
The sample consists of all NYSE, Amex, and Nasdaq firms on the
CRSP tapes, present on the last day of the prior calendar year.
The sample mean of the estimated slopes within each decile is
represented by the solid line. The 95% Bonferroni band is represented
by the dashed line.
Figure 7. Slope coefficients from January spline regressions,
1980-1994. The fifteen January spline regressions of return
on size (the natural logarithm of the market value of equity)
were estimated for each year, 1980 to 1994. For each year, the
estimated slope for each size decile is represented by a circle
(bubble). The size deciles are determined by only NYSE firms.
The sample consists of all NYSE, Amex, and Nasdaq firms on the
CRSP tapes, present on the last day of the prior calendar year.
The sample mean of the estimated slopes within each decile is
represented by the solid line. The 95% Bonferroni band is represented
by the dashed line.
Figure 8. Slope coefficients from February-December spline
regressions, 1980-1994. The fifteen February-December spline
regressions of return on size (the natural logarithm of the market
value of equity) were estimated for each year, 1980 to 1994.
For each year, the estimated slope for each size decile is represented
by a circle (bubble). The size deciles are determined by only
NYSE firms. The sample consists of all NYSE, Amex, and Nasdaq
firms on the CRSP tapes, present on the last day of the prior
calendar year. The sample mean of the estimated slopes within
each decile is represented by the solid line. The 95% Bonferroni
band is represented by the dashed line.