 Figure 2-Kernel Estimate
of Equilibrium Wage Offer Density
Figure 2-Kernel Estimate
of Equilibrium Wage Offer Density
This paper studies estimation of the number and location of modes
of the wage distribution. The location of the modes can be used
to estimate the cutpoints of the equilibrium wage distribution
(Bowlus, Kiefer, and Neumann, 1995) in the presence of measurement
error. These cutpoints can be used to classify workers into productivity
classes; Company wage data can be used to examine how well the
classification method works. We illustrate its use with wage
and employment data from the Danish IDA data, a longitudinal dataset
containing information about all workers in a 5% sample of firms
from 1980-1991.
Keywords: Equilibrium wage distribution bump hunting wage variability
0. Introduction.
Wage variability among individuals with similar observed characteristics
is substantial. For example, the leading empirical approach to
analysis of wages --the human capital approach-- typically accounts
for only 10-20% of the variation in wages across individuals.
Explanations of the remaining variability in wages have been
diverse, although often with little empirical content. Typically,
an appeal is made to company wage policy (see for example, Kerr(1954)
on internal labor markets, and Hicks (1932) on the "Gospel
of High Wages") without specifying exactly what problem wage
policy was supposed to solve. Underlying these early discussions
of company wage policy is the idea that wages influence turnover
and recruitment behavior, although exactly how this was to work
usually was left unstated.
Although early discussions of wage policy are often colorful,
formal content has been given to the ideas only recently in equilibrium
search models by Albrecht and Axell (1984), Burdett (1990), Burdett
and Mortensen (1995), and Mortensen (1990). In competitive models
wage policy doesn't matter because by definition in equilibrium
the law of one price holds: all workers of a given type receive
the same wage. In standadrd monopsony models of the labor market
(Card and Krueger (1995)) wage policy does not matter either because
the law of one price still holds, albeit at lower than the competitive
level. In these cases there is no role for company wage policy.
In contrast, search models generate dynamic monopsony power for
employers due to the presence of frictions such as the length
of time it takes to find a new job, and in this class of models
employer wage policy, that is, the choice to pay high or low wages,
is the central equilibrium concept.
Because the simplest equilibrium search models focus exclusively
on the turnover and recruitment role of wages, the equilibrium
wage distribution that the theory produces is hopelessly at odds
with empirical facts about wages. To align worker and firm interests
the equilibrium wage density must be strictly increasing on its
support. But it is well known that income distributions have
a long skinny right tail, and so too, upon investigation, do wage
distributions (Kiefer and Neumann, 1994; Van den Berg and Ridder,
1994). One way that the theory of turnover and recruitment can
be reconciled with the empirical evidence on wages is by heterogeneity
in productivity across firms. If inter-firm productivity differences
exist, then their identification and measurement are important
for understanding the role of company wage policy.
It is, of course, not obvious that inter-firm differences in productivity
are important sources of wage variability. For example, in competitive
markets inter-firm differences in productivity would appear only
in quantities, not in wages. High productivity firms would employ
a greater number of workers so that marginal produvtivity was
equalized across firms. Thus an essential part of the story rests
on incomplete factor mobility; there must also be a reason why
firms want to pay higher wages. Hicks in his "Gospel of
High Wages" story recounts how "...unusually successful
employers pay high wages to have the pick of the market (Hicks,
1932, p. 36)." If labor is priced out in efficiency units,
and these "picks of the market" simply have more units
of the observed or unobserved dimension of quality, the result
will be a standard compensating wage differential equilibrium,
with no additional role for company wage policy. Alternatively,
if the pick of the market interacts positively with other scarce
factors owned by the firm, firms that hire high quality labor
will be, as Hicks implicitly claimed, "unusually" successful
and will bid higher for the pick of the market.
This paper makes two contributions to the literature on equilibrium
search models. First, we cast the problem of determining the
number of productivity types into a search for modes of the wage
distribution and we use recent techniques of mode hunting to estimate
the number and location of these modes. We implement this approach
using data on individual wages for Danish workers in 1990. Second,
because the Danish data is organized by establishments we are
able to provide a decomposition of the wage distribution into
firm and worker characteristics which allows an assessment of
how important company wage policy is. The plan of the paper is
as follows. In section I we characterize the distribution of
wages that is implied by equilibrium search models. Section II
describes the approach to testing for multi-modality that we use,
and section III describes the data that we use. The fourth section
shows our results on estimating the modes of the distribution
and how it is affected by firm and worker heterogeneity. The
fifth section provides a summary and conclusion
I. Wage Distributions and Search Models.
Equilibrium search models are characterized by imperfect competition for workers. In the simplest case described by Mortensen (1990), unemployed workers receive job offers from a wage offer distribution F(w), which arrive at rate 0 per period; while employed workers receive job offers at rate 1 per period. Finally jobs are destroyed at rate per period. Workers set a reservation wage, R, and move to higher paying jobs as opportunities arise. All firms have the same production technology, denoted by productivity P, and maximize profits by the choice of the wage. The firm's problem is
(1)
Mortensen (1990) and Burdett and Mortensen (1995) show that the steady state flow supply of labor curve facing each firm in a labor marlket with M participants is
(2)
and that Nash equilibrium implies that the wage distribution is
(3) F(W) = .
The cross-firm earnings distribution, G(W), which reflects both the wage offer distribution and the mobility process can be shown to be (Ridder and Van Den Berg (1995)):
(4) G(W) =
=
Equations (2)-(4) are the dynamic monopsony solution with multiple firms. Each firm solves the usual static monopsony problem, yielding the 1st order condition:
(5)
and the equal profit condition , imposed on all firms scallops
out the wage distribution.
Because firms are all alike and because workers always prefer higher wages to lower wages, the equilibrium wage offer distribution inherits the monotonicty property of L(W) - > 0 W. This feature of the model is at odds with empirical evidence on income and wage distributions (Kiefer and Neumann (1994), and Bowlus, Kiefer, and Neumann(1995) {BKN}) which typically have concave CDF's, while F and G are convex. Several papers have shown that the inconsistency between the empirical and theoretical wage distributions can be reconciled if firms are heterogeneous in productivity. For the discrete mixture case the equilibrium wage distribution is given by:
(6) F(W) =
where is the lowest wage offered by a firm of type j (P= Pj) and is the highest wage offered by a type j firm. The fraction of firms having productivity less than Pj is j . The highest and lowest wages offered by adjacent types are related by
(7) .
Thus the wage offer distribution is continuous but not differentiable
at these points, which BKN call cut-points. They show
that estimates of the cutpoints converge to their true values
at rate N rather than , and they provide an algorithm for constructing
the estimates. Figure 1 shows the wage offer density for the
case of 4 firm types with 1 = .61, 2 = .82,
3 = .94, and 4 =1.0.
Figure 1-Equilibrium Wage Offer Density
Estimates of these cutpoints are sensitive to a variety of model specification errors, including measurement error in W. Because of this sensitivity we are interested in alternative approaches that preserve the essential property of the equilibrium search model --the upward sloping density. If firms differ in productivity levels and if there is some additional noise in the wage data, the sharp cutpoints depicted in figure 2 will not appear. Instead, because each segment of the true density is upward sloping, the observed wage distribution will appear to be multi modal, with the modes located around the cutpoints. For example drawing a sample of 1,000 observations from the true distribution shown in figure 1 and fitting a kernel density estimate to the data results in the density shown in figure 2.
Figure 2-Kernel Estimate
of Equilibrium Wage Offer Density
Figure 2 was obtained with a gaussian kernel using a bandwidth of 11.2, where the bandwidth was chosen to produce undersmoothing.
Of course measurement error, if large enough, can completely obscure modes in the underlying, true wage distribution. For example, let the relation between true wages, W, and measured wages, Z, be given by
(8)
where g and f are the probability density functions of X and W, and we assume that X and W are independently distributed. The distribution of measured wages is:
(9)
and the mode(s) are located at the solutions to
(10) .
Two approaches are possible. For f() known, since h(Z) is observable g(X) can be recovered by deconvoluting (9). Since f() is known only up to N consistent estimators the deconvolution problem is quite difficult, and we defer this to later work. Alternatively, if the measurement error problem is not too severe one can use the modes of h(Z) to estimate the modes of f. For the special case of the uniform distribution on {-a,+a} one can show that if f(W) has Q cutpoints, h(Z) will have Q solutions to (10) provided that the minimum distance between modes is greater than a. Furthermore, the estimated location of the mode will differ from the cutpoint of the distribution by no more than a. Other additive measurement error specifications can obscure the modes if the range of X is large, as will distributions that work with multiplicative specifications. In short, even if the modes truly exist, measurement error may make it difficult to find them. Ultimately, it is an empirical question as to how reliably they can be estimated..
Knowledge of the location of the modes of the wage distribution allows classification of firms into productivity classes, and within productivity class, into high wage and low wage firms. If panel data are available on firms one can measure productivity change over time, as well as the effects of such changes on the distribution of wages.
Construction of estimates of the wage distribution that we propose does not require information about firms; it is based entirely on individual data. But if workers are classified by firms it is possible to measure the importance of company wage policy. For example, we would expect that if worker i in firm j is paid high relative to the market, so too would worker i' in firm j. Indeed, if workers were homogeneous we would expect that all workers in firm j would be paid the same. Of course, workers may be heterogeneous in ways that are not observable to the econometrician, so a specification of the wage distribution that allows for inter-individual variation is:
(11) , ,
with the variance in wages composed as:
(12) .
In this characterization the quantitative importance of company wage policy is measured by 1- SI, (whereis the fraction of log wage variation attributable to individuals.)
Of course, any specification of workers of "like skills" --e.g., unskilled workers, plumbers, certified accountants-- will encompass individuals who differ in measurable as well as unmeasured characteristics., with education, and experience being the most obvious. To encompass this case we assume that the wage distribution is characterized by:
(13)
The X's contain measurements on all factors for which compensating wage differentials are paid --e.g., experience, education, location. We construct W*exp() by fitting a regression of log wages to characteristics, capturing the residuals and generating for each individual the transformed wage
(14)
where is the sample mean of the characteristics, is the conformable ols estimator of the implicit price of X, and is the ols residual. Thus we assume that individual specific characteristics affect the distribution of wages only by shifting the mean. Thus, for the case of measured heterogeneity we assume that the variance of transformed wages can be decomposed as
(15) ,
and that the importance of company wage policy is measured by
1-SI.
II. The Number of Productivity Classes.
We are interested in calculating the number of modes of the wage distribution, and their location, as a way to classify firms into productivity classes. One way to do so is to obtain an estimate of the wage density by any of several methods, and to count the modes appearing in it. This raises the question of determining how many of these modes are real features of the underlying wage density, f(w), and how many are just statistical quirks of the the estimator. There are several approaches to the problem of detecting multimodality in the statistical literature; we follow the kernel density estimation approach of Silverman (1981), although we also explore modifications to this approach suggested by Fisher, Mammen, and Marron (1994).
The kernel density estimator for iid data X1, X2, ...,XN, drawn from the density f(x) is defined by
(16)
where N is the sample size, h is the bandwidth, and K is called the kernel function. The empirical issue is to decide which modes of truly reflect modes of f(x) rather than spurious fine detail in the data due to sampling variability. Letting m demote the the actual number of modes of f, Silverman proposed tests of the hypotheses: H0: m = j versus H1: m j+1, j= 1,2..... Silverman's test is based on the observation that ( for K unimodal) the number of modes of equals N for h sufficiently small (one for each data point) and equals 1 for h sufficiently large. For certain kernels, notably the normal, the number of modes of is a decreasing function of h. For such kernels there will be a critical value of the bandwidth, hcrit, j for which just balances between having j and j+1 modes. When m j+1, hcrit, will have to be large in order to smooth away the j+1'th mode. To assess whether hcrit, j is large, we use the bootstrap P-value defined by
(17) ,
where P* is the probability with respect to the bootstrap sample X*1,...,X*N, and h*crit, j is the critical bandwidth for the kernel estimator which is constructed from the bootstrap data, and R is a scaling factor. Thus the procedure is to (a) determine hcrit, j from the data; (b) draw a sample of N observations from and (c) compute from this sample the critical bandwidth for j modes.
Because the sampling is from , not f, some scaling of the data must be performed. Silverman, noting that the variance of is (when ), where is the sample variance, proposed rescaling the data obtained from sampling from by X* = X*RS , where
(18) RS = .
Fisher et al. (1994) suggest using
(19) RF = ,
and give formulas for computing an estimator of the numerator term in (16). Monte Carlo evidence reported in Fisher et al. (1994) suggests that scaling by RF has greater power than scaling by RS, at least using simulated data. We investigate this proposition using actual data in section IV.
III. Data.
The data used are observations on wages of unskilled and skilled workers taken from the IDA dataset maintained by the Centre for Labour Market and Social Research of Denmark. These data are from a random sample of 5% of all Danish workplaces with employment levels between 5 and 500 workers in 1980, which are then followed through 1991. Data is obtained on all individuals employed by these firms for as long as they remain with the firm. In addition, firm leavers are followed for one year, and data for the prior year are obtained for all new entrants to the data set. The data are register-based, and annual earnings data are reliable. The hourly wage variable is computed from annual income, weeks of employment, and hours per week worked. We selected the two categories ofunskilled and skilled workers the analysis. We use data on education ,age, gender, and region, and earnings for 3,581 unskilled and 4,525 skilled males in 1990. We truncated the sample by excluding wages that were unusually high or unusually low in value. The sample characteristics of the data used are shown in Tables 1a and 1b.
| |||||
| variable | Mean | Std. dev. | Minimum | Maximum | |
| AGE | 36.72 | 12.29 | 16 | 78 | |
| Education
% :General | 71.9 | 45.9 | 0 | 1 | |
| HS | 4.6 | 20.9 | 0 | 1 | |
| BA | 0.4 | 6.1 | 0 | 1 | |
| MA | 0.3 | 5.0 | 0 | 1 | |
| Wage(DKK) | 128.7 | 32.3 | 32.0 | 232.0 | |
| Wage(-adj) | 128.7 | 13.5 | 84.7 | 192.4 | |
| |||||
| variable | Mean | Std. dev. | Minimum | Maximum | |
| AGE | 34.87 | 11.49 | 16 | 68 | |
| Education
% :General | 26.2 | 46.6 | 0 | 1 | |
| HS | 5.5 | 22.81 | 0 | 1 | |
| BA | 0.1 | 2.9 | 0 | 1 | |
| MA | 0.1 | 3.9 | 0 | 1 | |
| Wage(DKK) | 132.1 | 41.7 | 32.0 | 280.0 | |
| Wage(-adj) | 132.7 | 7.5 | 112.7 | 178.6 | |
To obtain wages adjusted for observable characteristics we regressed log(W) on indicators for education level (5), one-digit SIC industry (8), region (7), and on age and age squared. The 22 regressors explain 19% of the variance in unskilled (log) wages and 27% of the variance of (log) skilled wages.. Summary statistics for predicted wages are shown in the last rowsof Table 1. By construction the mean is identical to the unadjusted series, but the variance is smaller., substantially so in the case of skilled workers.
IV. Modes of the Wage Distribution.
We calculated kernel density estimates of the wage densities for
skilled and unskilled workers choosing the bandwidth, as is common
in applied work, by cross-validation. The results are shown in
figures 3 and 4. Unskilled workers 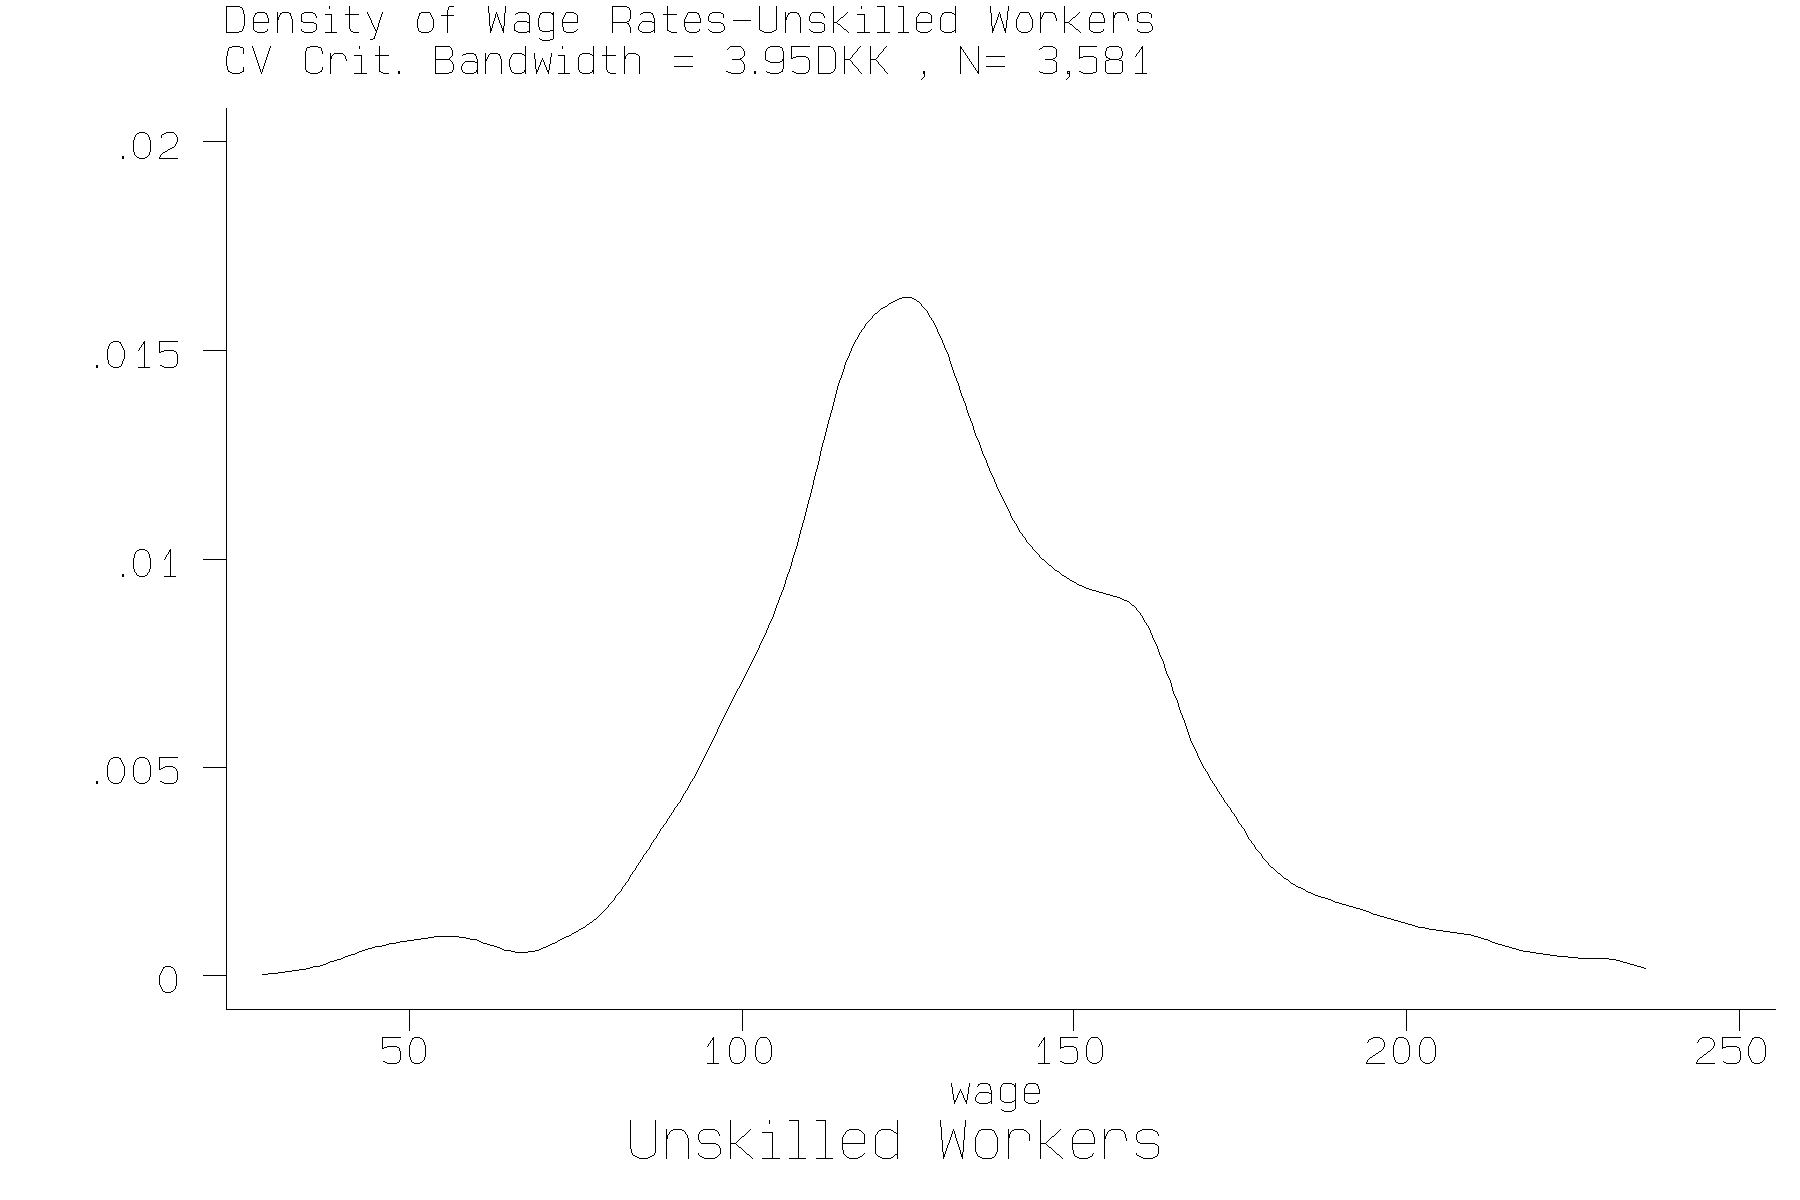
Figure 3 Wage Density of Unskilled Workers, Chosen by Cross-Validation
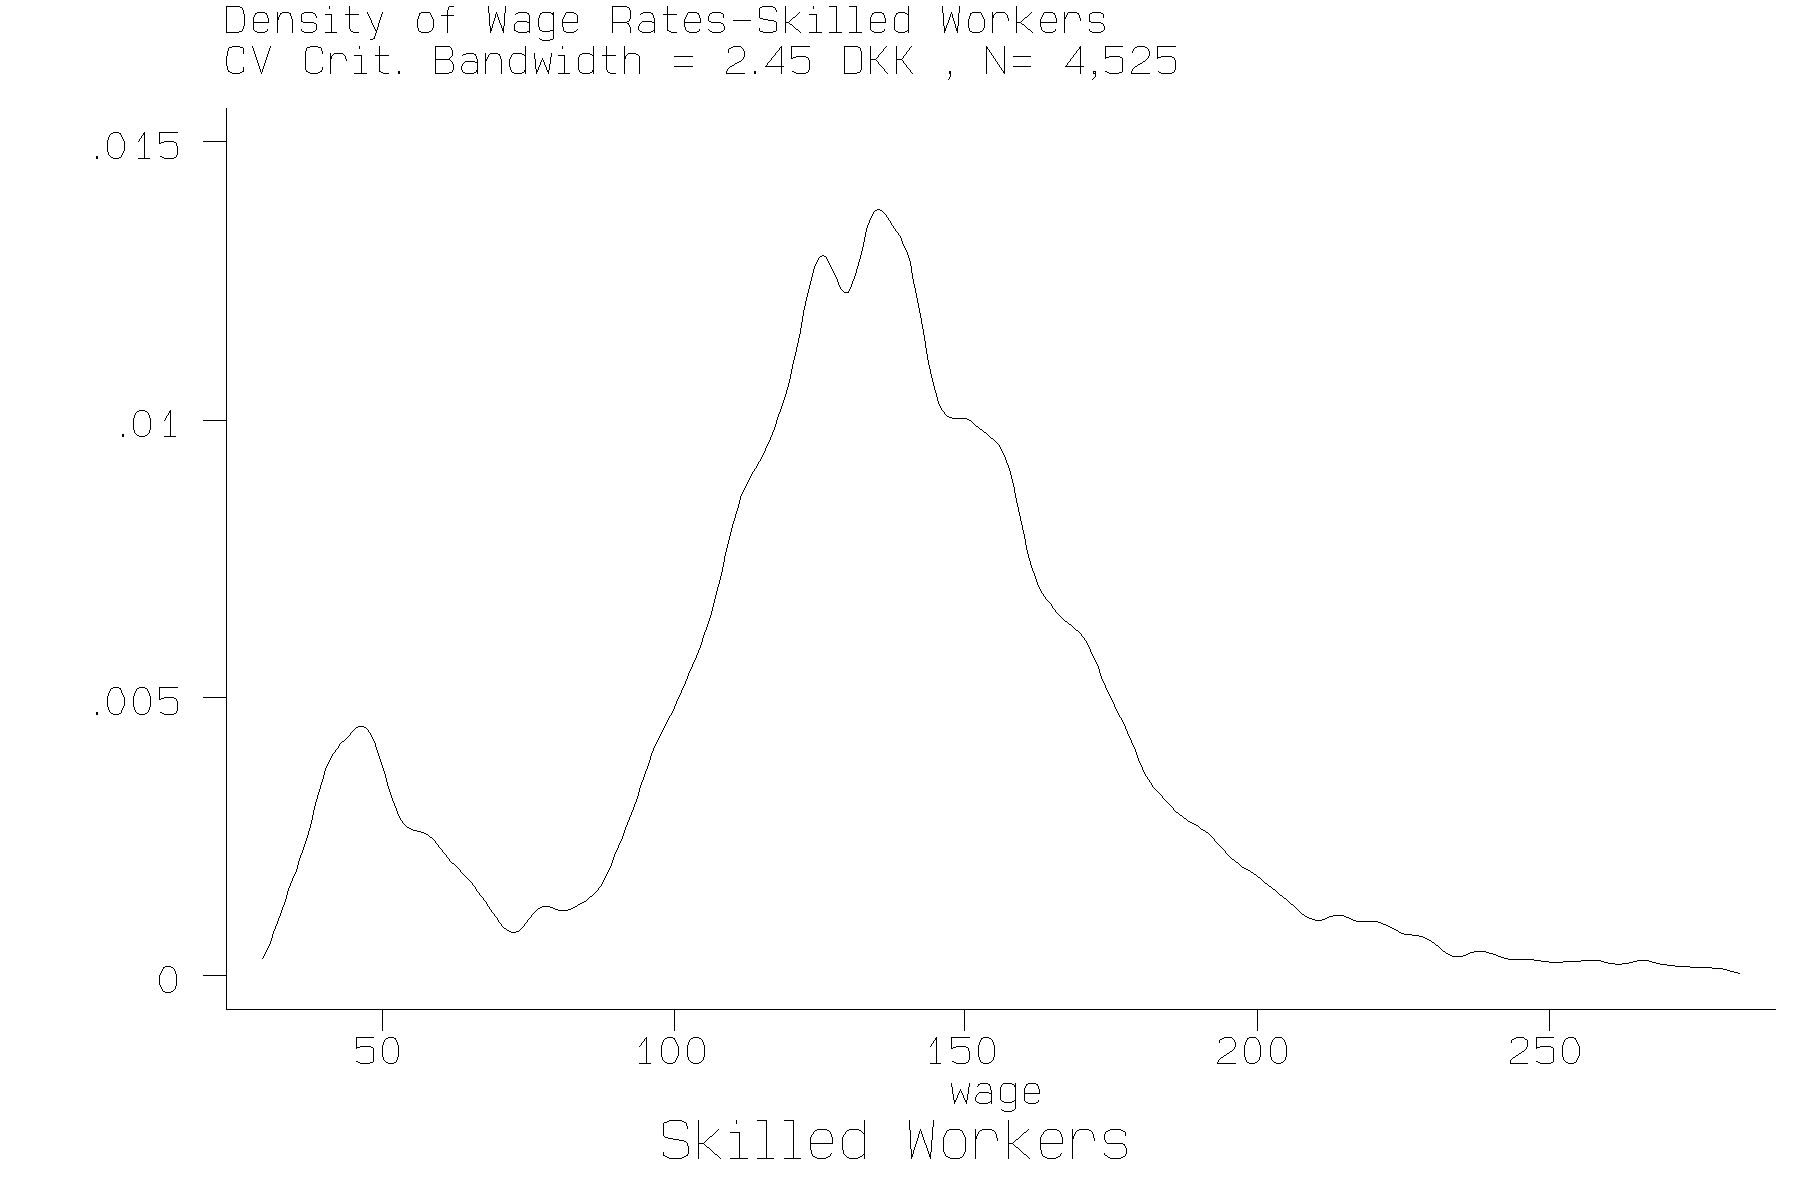
appear to have two modes in the wage distribution, one at about
56 DKK per hour and one at 124 DKK, while Skilled workers appear
to have 12 modes, not all of which are obvious in figure 4. Table
2 gives the critical bandwidths, the significance levels, and
the scaling factor for tests of the null hypothesis that the underlying
distribution has at most k modes against the alternative that
it has more than k modes. These tests are constructed by taking
100 bootsrap samples of 3,581 observations from the unskilled
worker data and 4,525 observations from the skilled worker
| ||||||
| Silverman R Fisher et al. R | ||||||
| No. of Modes | hcrit,j | P-value | R | P-value | R | |
| Unskilled Wages: | ||||||
| 1 | 8.78 | 0.000 | 0.9602 | 0.000 | 1.5066 | |
| 2 | 3.92 | 0.768 | 0.9919 | 0.777 | 0.9940 | |
| 3 | 3.34 | 0.798 | 0.9939 | 0.980 | 0.8753 | |
| 4 | 3.03 | 0.758 | 0.9950 | 1.000 | 0.7995 | |
| 5 | 2.85 | 0.636 | 0.9956 | 1.000 | 0.7690 | |
| Skilled Wages: | ||||||
| 1 | 18.87 | 0.000 | 0.9111 | 0.000 | 3.3882 | |
| 2 | 4.03 | 0.970 | 0.9954 | 0.475 | 1.6171 | |
| 3 | 3.95 | 0.859 | 0.9955 | 0.020 | 1.5708 | |
| 4 | 3.55 | 0.798 | 0.9964 | 0.020 | 1.3965 | |
| 5 | 3.43 | 0.455 | 0.9966 | 0.010 | 1.3779 | |
data and calculating the probability described in (2). The results are given for k = 1,..5, so that the tests are best thought of as a hierarchical set of significance tests. For unskilled wages tests using the Silverman scaling factor and the Fisher et al. scaling factor coincide in the inference to be drawn. Both reject the null hypothesis that there is but one mode, while the hypothesis that there are more than two modes finds little favor in these data.
For skilled workers the picture is more complicated. The Silverman
scaling factor leads to a choice of modes = 2, and the Fisher
et al scaling factors agrees that two modes would be prefferred
to 1 or 3 modes, however, the hypothesis of 3 modes is rejected
over 4, and 4 is rejected over 5., leading to a conflict in inference.
The problem arises because the estimate of RF is greater
than 1, as shown in column 6 of the table. This leads to rejection
too often. Figures 5 and 6 show the estimated wage densities,
calculated at the.  Figure
5 - Kernel Density estimates with critical bandwidth - Unskilled
Workers
Figure
5 - Kernel Density estimates with critical bandwidth - Unskilled
Workers
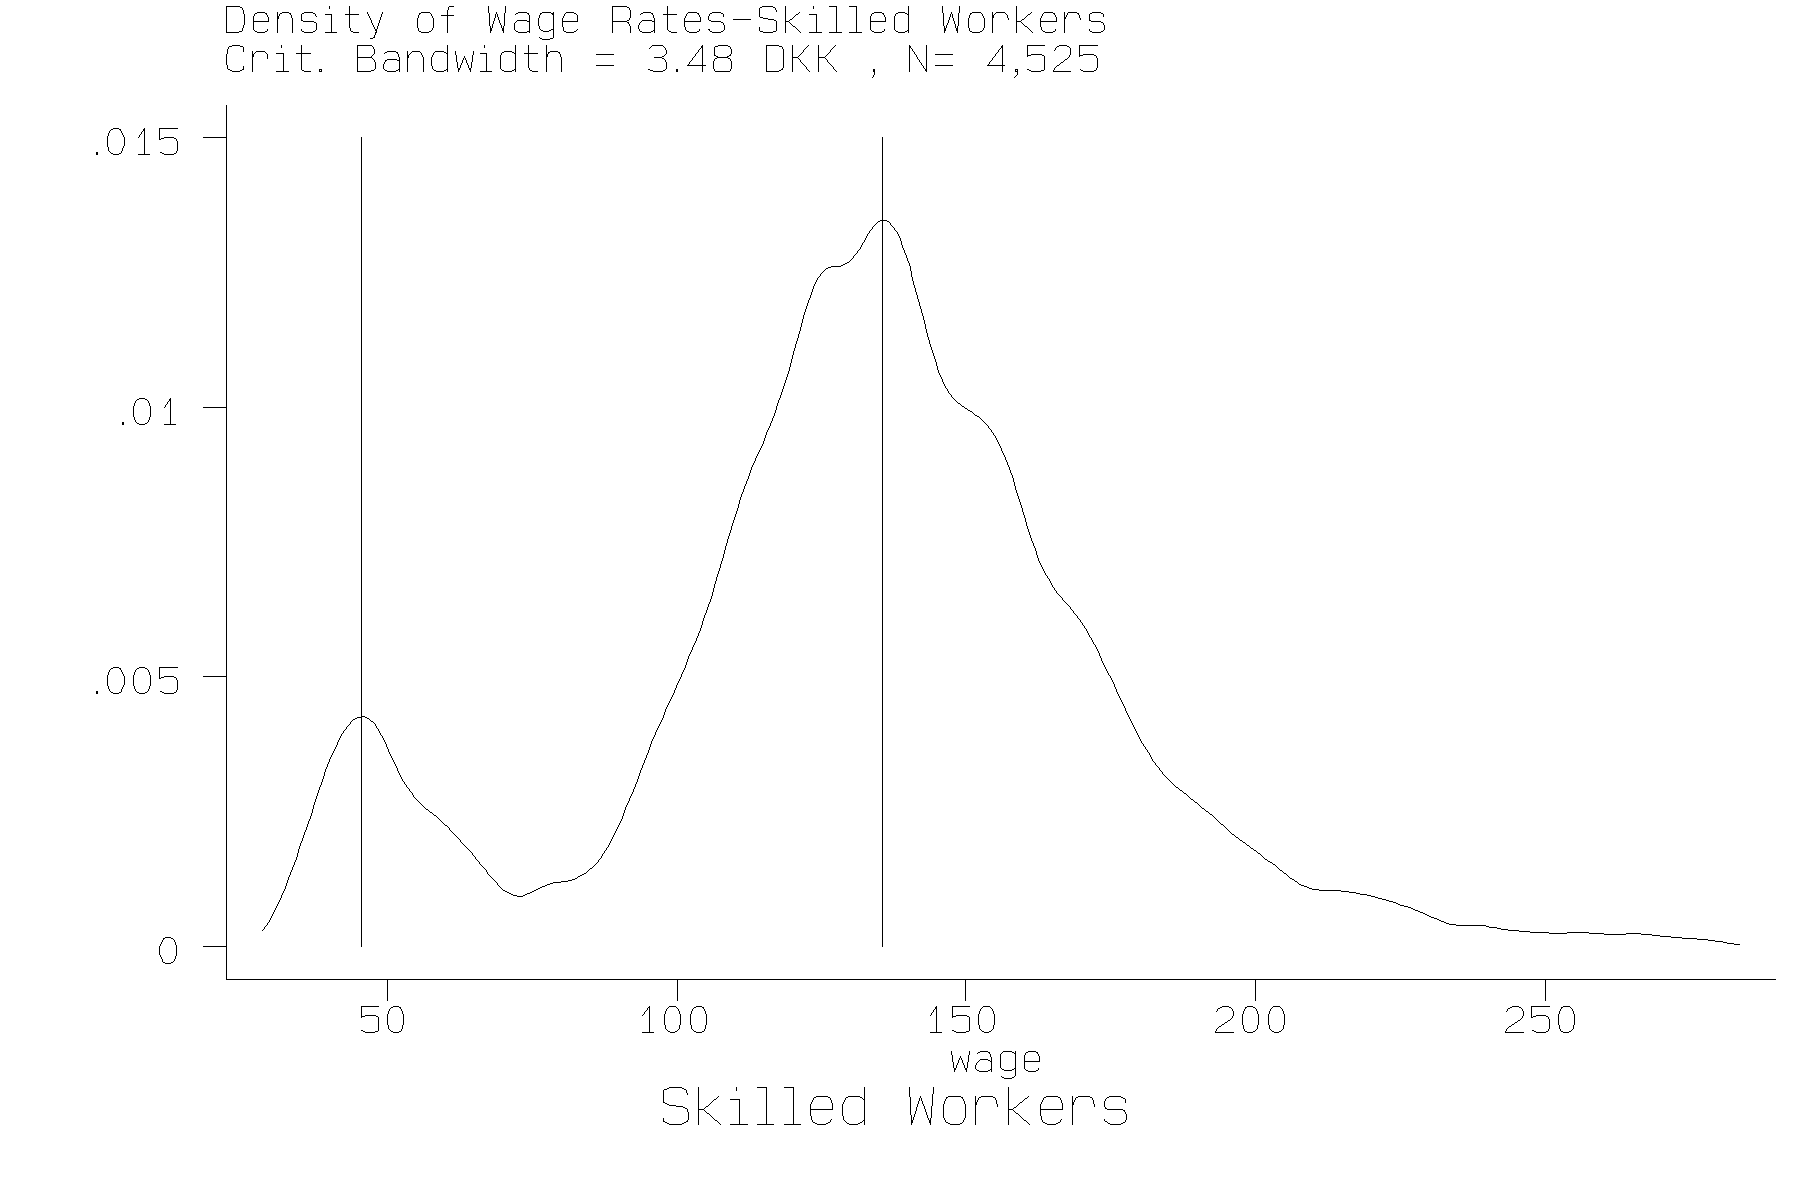 Figure 6 Kernel Density estimates with
critical bandwidth - Skilled Workers
Figure 6 Kernel Density estimates with
critical bandwidth - Skilled Workers
value of hcrit,j consistent with two modes for both skilled and unskilled workers. The 3 or 4 additional modes that would be drawn for the skilled worker data are all in the right tail at values above 220 DKK, which is around the 4th percentile of the wage distribution. Evidently, estimates of RF are sensitive to the roughness of the data, particularly the existence of long right tails. Consequently, in Table 2 and subsequentl tables we ignore results where RF > 1. {Note that RS 1 by construction.}
We repeated the analysis using regression adjusted wage rates, where we have controlled for age, region, industry, and educational differences among workers. The test results are shown in Table 3.
| ||||||
| Silverman R Fisher et al. R | ||||||
| No. of Modes | hcrit,j | P-value | R | P-value | R | |
| Unskilled Wages: | ||||||
| 1 | 2.50 | 0.475 | 0.9840 | 0.495 | 1.0112 | |
| 2 | 1.67 | 0.919 | 0.9927 | 1.000 | 0.7654 | |
| 3 | 1.59 | 0.808 | 0.9934 | 1.000 | 0.7336 | |
| 4 | 1.55 | 0.606 | 0.9938 | 1.000 | 0.7110 | |
| 5 | 1.41 | 0.636 | 0.9948 | 1.000 | 0.6448 | |
| Skilled Wages: | ||||||
| 1 | 2.25 | 0.838 | 0.9576 | 0.394 | 1.3885 | |
| 2 | 1.97 | 0.404 | 0.9671 | 0.050 | 1.3228 | |
| 3 | 1.80 | 0.111 | 0.9725 | 0.010 | 1.2720 | |
| 4 | 1.09 | 0.626 | 0.9895 | 0.677 | 0.9847 | |
| 5 | 1.06 | 0.333 | 0.9901 | 0.566 | 0.9600 | |
Both unskilled and skilled wages that are adjusted for observable characteristics indicate that one mode fits the data best, although again, estimates of RF are sensitive to tail area observations. The density estimates are displayed in figures 7 and 8.
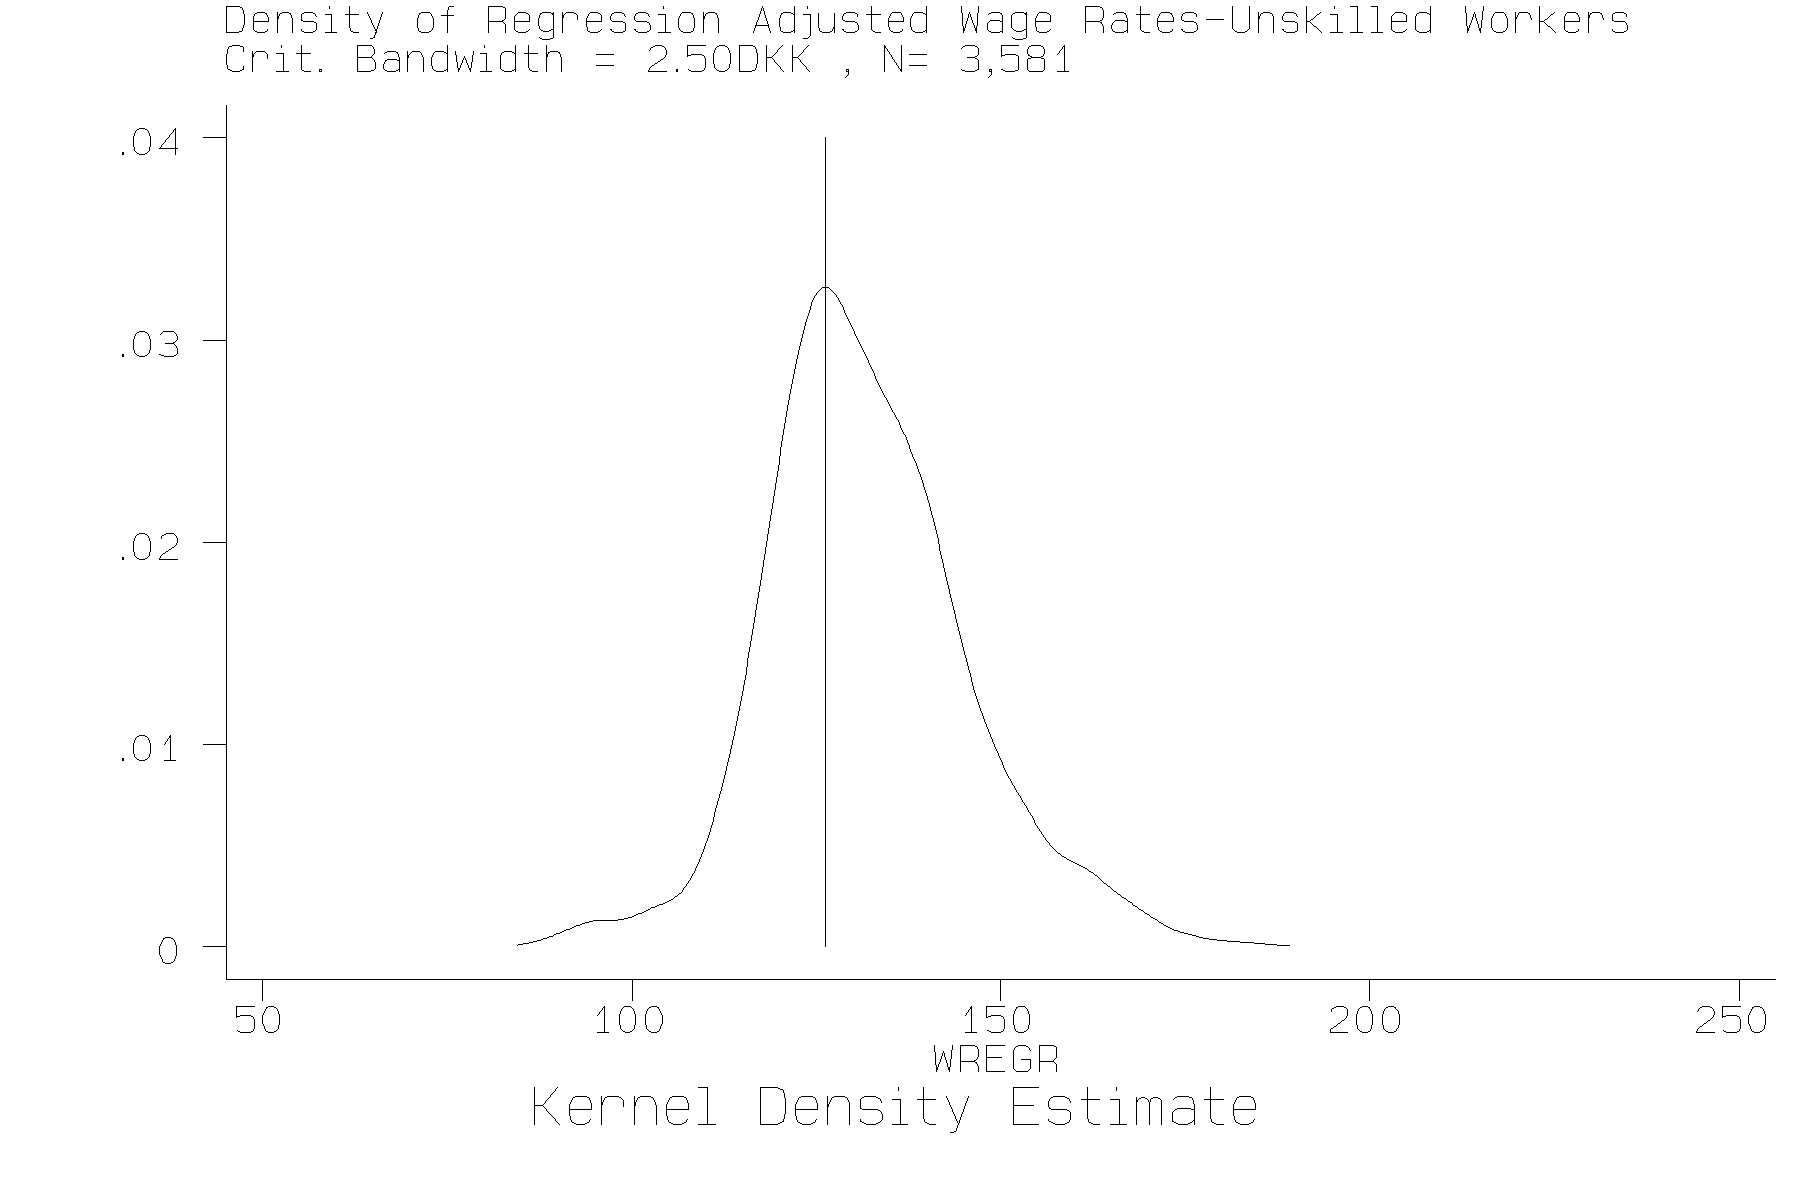 Figure 7 Kernel Density estimates
with critical bandwidth -Unskilled Workers Adjusted wages.
Figure 7 Kernel Density estimates
with critical bandwidth -Unskilled Workers Adjusted wages.
 Figure 8 Kernel Density estimates
with critical bandwidth - Skilled Workers Adjusted wages
Figure 8 Kernel Density estimates
with critical bandwidth - Skilled Workers Adjusted wages
Using the skilled and unskilled wage data with firm identifiers allows us to assess how much of overall variance in wages is explained by firm specific effects. For these data the variance in wages is 912 DKK for unskilled workers and 1,741 DKK for skilled workers. Decomposing this into firm effects --i.e., using a fixed effects regression on a constant, yields a residual of 437 DKK for unskilled workers and 1,231 DKK for skilled workers, implying that differences across firms potentially accounts for 52% (1 - 437/912) of unskilled worker wage variation and 30% of the variance in skilled worker wages. Of course workers differ in measured ways, and this may be one of the reasons why average wages vary across firms. We fit regression models using age, education, location and industry to the wage data, again using the standard fixed effects estimator. This led to firm effects accounting for 67% of the residual variance of unskilled worker wages and 59% for skilled worker wages. So these data point to a significant role for company wage policy in explaining the variation in wages. We consider know whether the modes we have identified capture the inter-firm variation.
Using the estimated number of modes and their location, we group the wage data by firm and inquire whether workers of the same skill class within the firm are classified as having the same productivity. For unskilled workers 80%, or 832 firms out of 1,037 paid unskilled workers wages that are in one productivity class, where the number of productivity classes equals the number of modes plus 1. For skilled workers the equivalent figure is 86% (1,105 out of 1289). Using regression adjusted wages does not change the picture: for unskilled workers 80.2 ((832/1,037) of firms pay individuals in the same productivity class, and 75% of firms (967/1,289) pay skilled workers in the same productivity class. Thus it appears that the classification of workers by the modes of the wage distribution captures some element of company wage policy. However, small number of modes -- 1-- identified after adjusting for measured covariate suggests that the attractiveness of this approach for measuring productivity differences is not high. Essentially we have found that the raw data have two or three distinct classes of worker-firm pairings, but that when we control for worker characteristics the distribution of wages is unimodal. This is consistent with at least two interpretations: (a) measurement error in wages effectively smoothes out true "modes" (or cutpoints) in the data, thereby rendering techniques of structural bump hunting unproductive; (b) the wage data are better described by a continuous distribution of productivity types. Because productivity itself is not observed directly in these models it is not obvious that these two explanations can be distinguished.
V. Conclusions.
Our conclusions are two-fold. On the technical level we find that mode-hunting techniques work well in characterizing economic data such as wage distributions. Because of the relatively large size samples available these tests for the existence of modes appear to work well. In principle there are reasons for believing that Fisher et al.'s scaling coefficient might perform better than that suggested by Silverman. But this approach uses information on 6th moments, and consequently it is sensitive to the form of the data, especially the assumption of Normality. On the substantive question of using mode-hunting techniques to detect cutpoints, our results are negative. In Danish data we could find, after adjusting for measured covariates, only one mode in the wage distribution. This may be due to measurement error having smeared away true, structural cut points or modes, or it may suggest that such discrete modes do not exist.
Albrecht, J. W., and B. Axell, [1984] "An Equilibrium Model
of Search Unemployment," Journal of Political Economy,
92:824-40.
van den Berg, G., and G. Ridder, [1995" Estimating Equilibrium
Search Models from Wage Data," in N. C. Westergård-Nielsen
and P. Jensen, eds., Proceedings of the Third Symposium On
Panel Data and Labour Market Dynamics, New York: North-Holland,
43-55.
Burdett, K., [1990], "Search Models: A Survey," University
of Essex Discussion Paper.
Bowlus, A., N. M. Kiefer, and G. R. Neumann, [1995], "Estimation
of equilibrium wage distributions with heterogeneity," Journal
of Applied Econometrics, v. 10, December, 119-31.
_______, 1996, "Fitting Equilibrium Search Models to Labour
Market Data," University of Iowa Department of Economics
Working Paper, February.
Burdett, K., and D. T. Mortensen, [1995], "Wage Differentials,
Employer Size, and Unemployment," International Economic
Review, forthcoming
Card, David, and Alan B. Krueger, [1995], Myth and Measurement:
The New Economics of the Minimum Wage, Princeton University
Press: Princeton, N.J.
Decker, S., Korsholm, L., and L. Muus., [1995], "An equilibrium search model with human capital accumulation," paper presented at the Conference on Equilibrium Search and Labor Market Dynamics, Sandbjer, Denmark, June 9-12.
Eckstein, Z., and K. I. Wolpin, [1990], "Estimating a Market
Equilibrium Search Model From Panel Data on Individuals,"
Econometrica, 58:783-808.
Fisher, N. I., Mammen, E., and J. S. Marron, [1994], "Testing
for multimodality," Computational Statistics and Data
Analysis, v. 18, 499-512.
Hicks, J. R., 1932, The Theory of Wages, MacMillan, London, 2nd edition, 1966
Kiefer, N.M., and G. R. Neumannn, [1994] "Wage Dispersion
with Homogeneity: The Empirical Equilibrium Search Model,"
in N. C. Westergård-Nielsen and P. Jensen, eds., Proceedings
of the Third Symposium On Panel Data and Labour Market Dynamics,
New York: North-Holland, 57-74.
Kerr, C. S., 1954, "The Balkanization of labor
markets," in E. Wright Bakke et al., eds., Labor Mobility
and Economic Opportunity, MIT Press, Cambridge, MA.
Koning, P., G. Ridder, and G. J. van den Berg, [1995], "Structural
and frictional unemployment in an equilibrium search model with
heterogeneous agents," Journal of Applied Econometrics,
v. 10, December, 133-51.
Mamen, E., Marron, J. S., and N. I. Fisher, [1992], "Some
asymptotics for multimodality tests based on kernel density estimates,"
Probability Theory and Related Fields, v. 91, no. 1, 115-32.
Mortensen, D. T., [1990] "Equilibrium Wage Distributions:
A Synthesis," in J. Hartog, G. Ridder, and J. Theeuwes, eds.,
Panel Data and Labor Market Studies, New York: North-Holland,
279-96.
Ridder, G. and G. van den Berg, 1995, "Empirical Equilibrium Search Models," Tinbergen Institute Discussion Paper TI3-95-225, November.
Silverman, B., W., [1981], "Using kernel density estimates to investigate multimodality," Journal of the Royal tatistical Society B, v. 43, 97-99.
_______, [1986], Density Estimation for Statistics and Data
Analysis, Chapman and Hall, London.